Logo HardwareVisualizer

HardwareVisualizer v1.11.0

Cooling Insight: understand CPU temperature through load and history.

Cooling Insight now lets you compare CPU temperature with load and past readings. Fresh installs use DuckDB for history, existing SQLite data can be converted, and Windows users can install PawnIO from Settings.

Cooling Insight

Was it warmer at a similar load?

A hotter CPU may simply be doing more work. Cooling Insight groups readings into idle, low, medium and high load, then compares temperatures between the baseline and recent periods.

Comparisons need enough recorded data. When samples are insufficient, the view shows that the comparison is not yet available.

A closer look at load and temperature

The Load × Temperature Explorer plots hourly average CPU load against hourly average CPU temperature. It separates the baseline and recent periods and shows medians by load band. Bands with too few recorded hours remain unassessed.

Compare within each CPU load band
Baseline period Recent period
Illustration of the comparison method. Not an application screenshot or measured data.
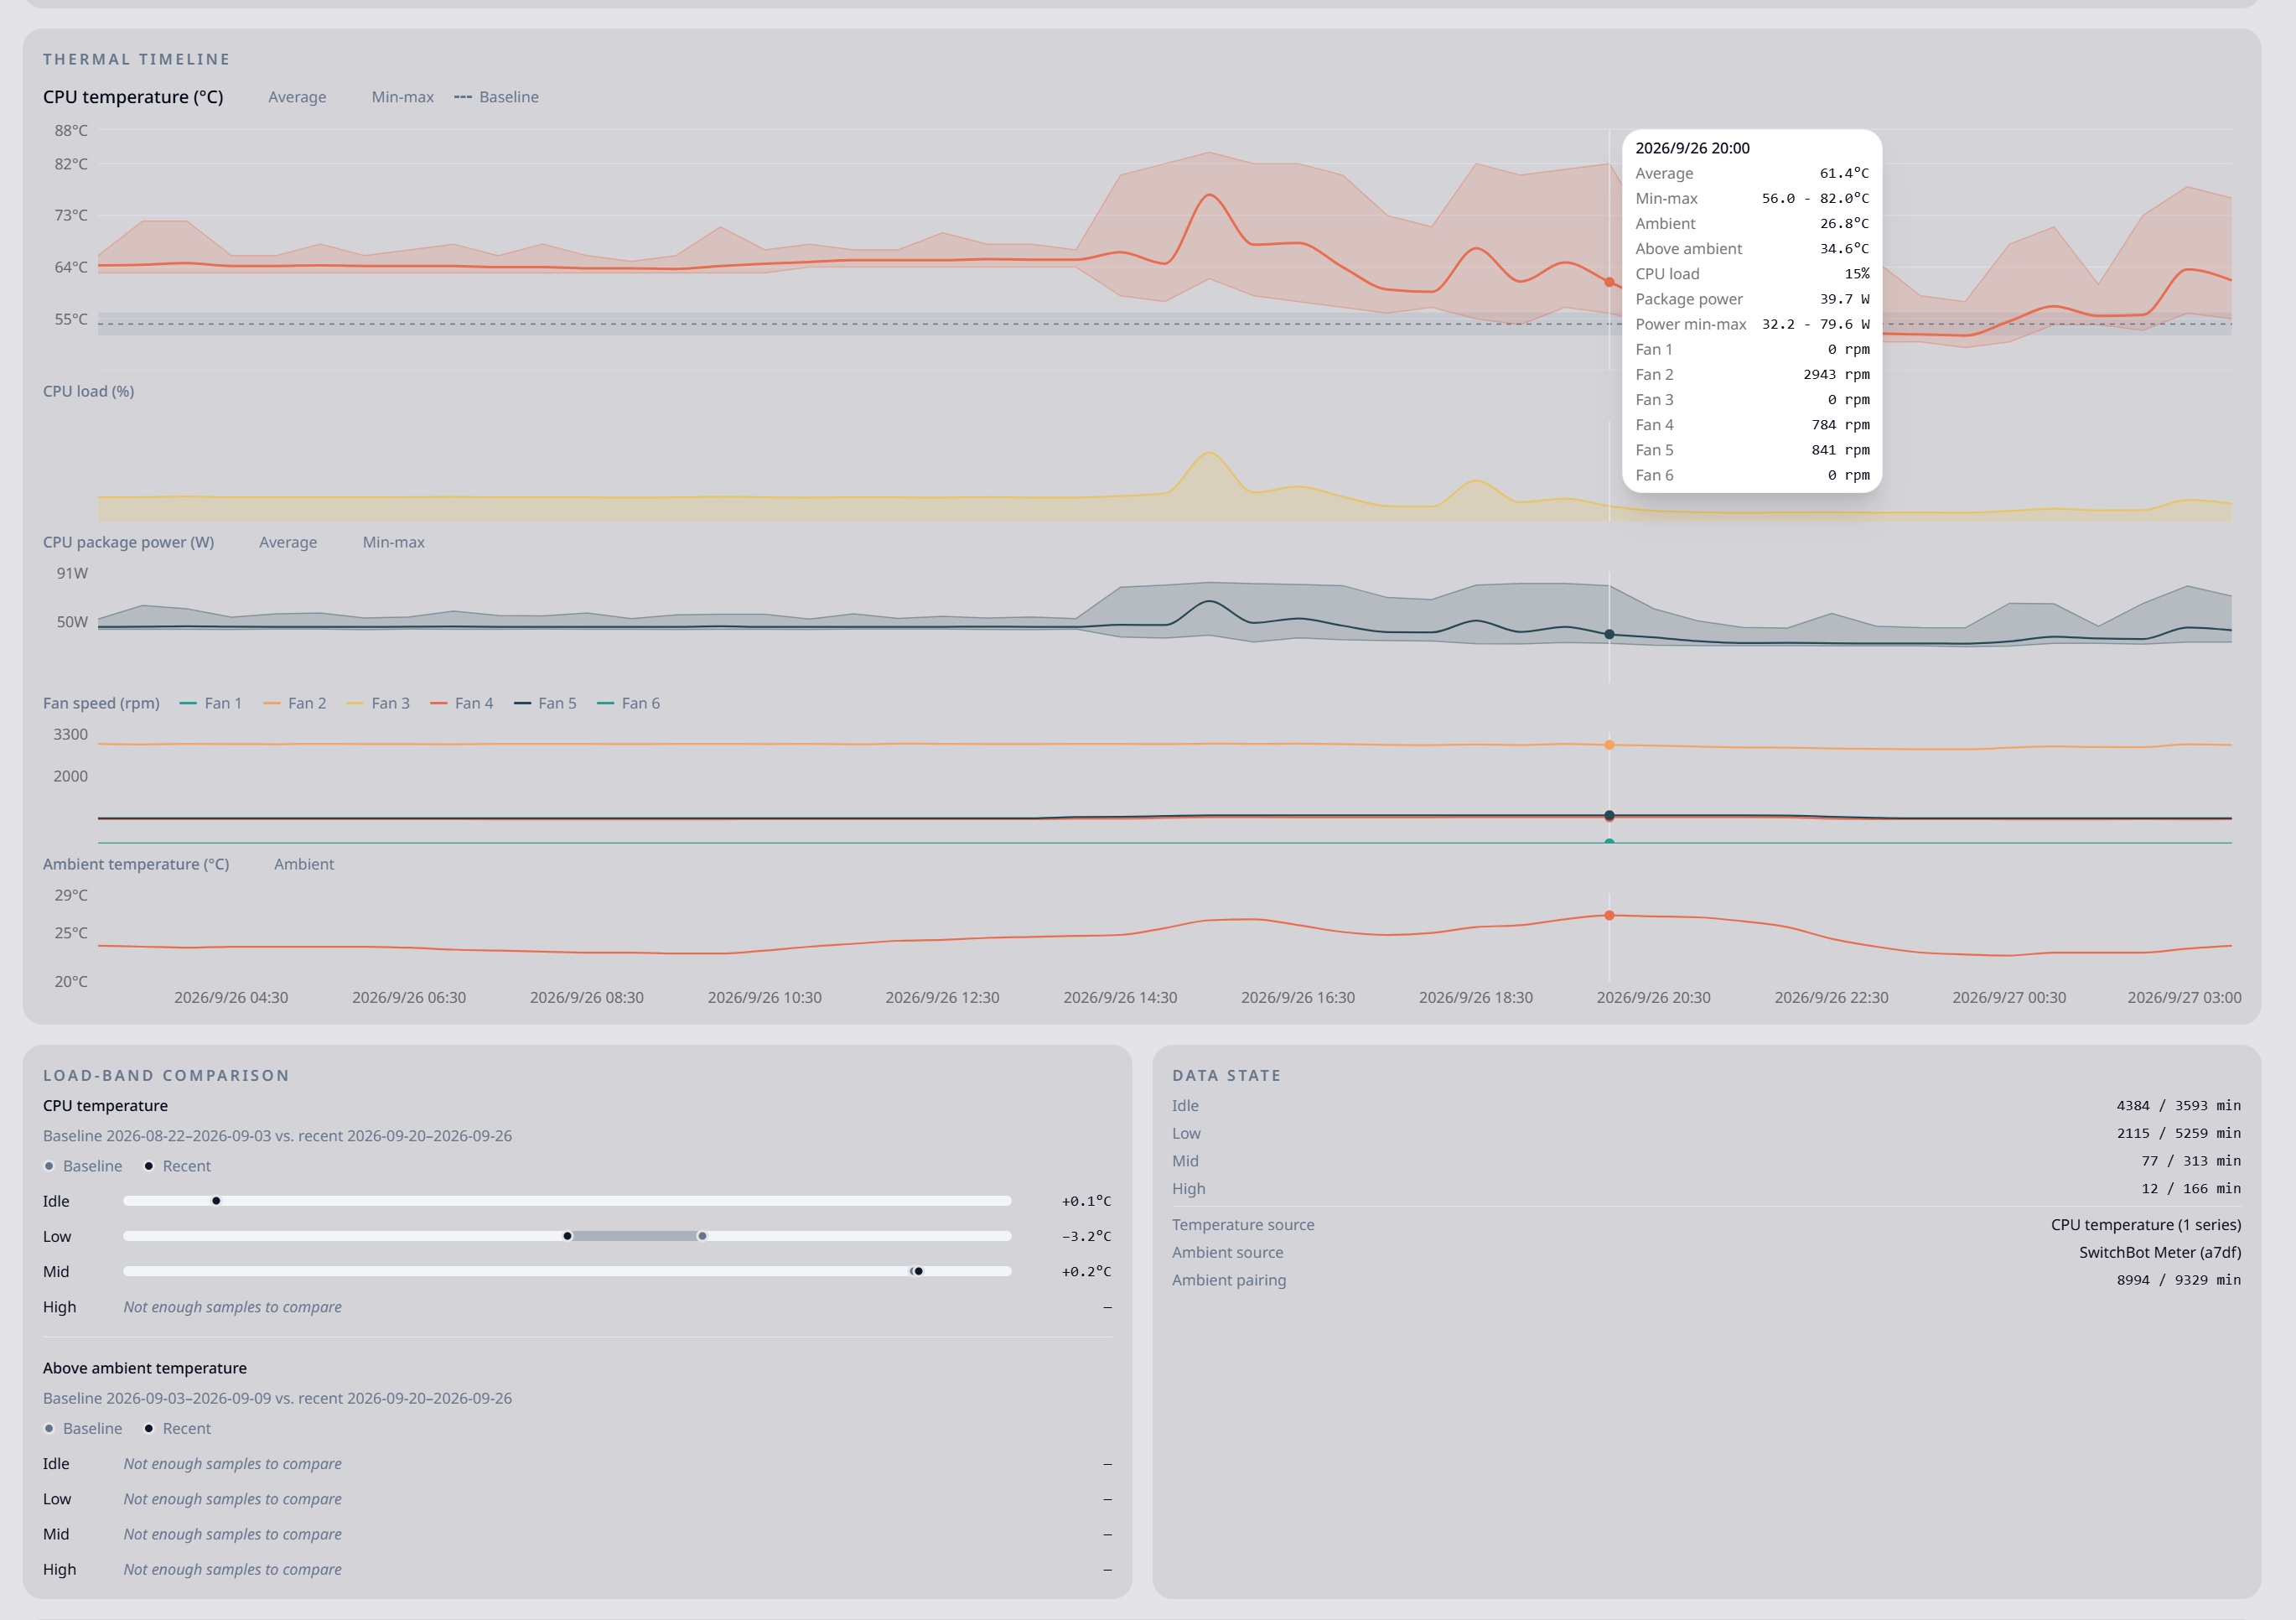
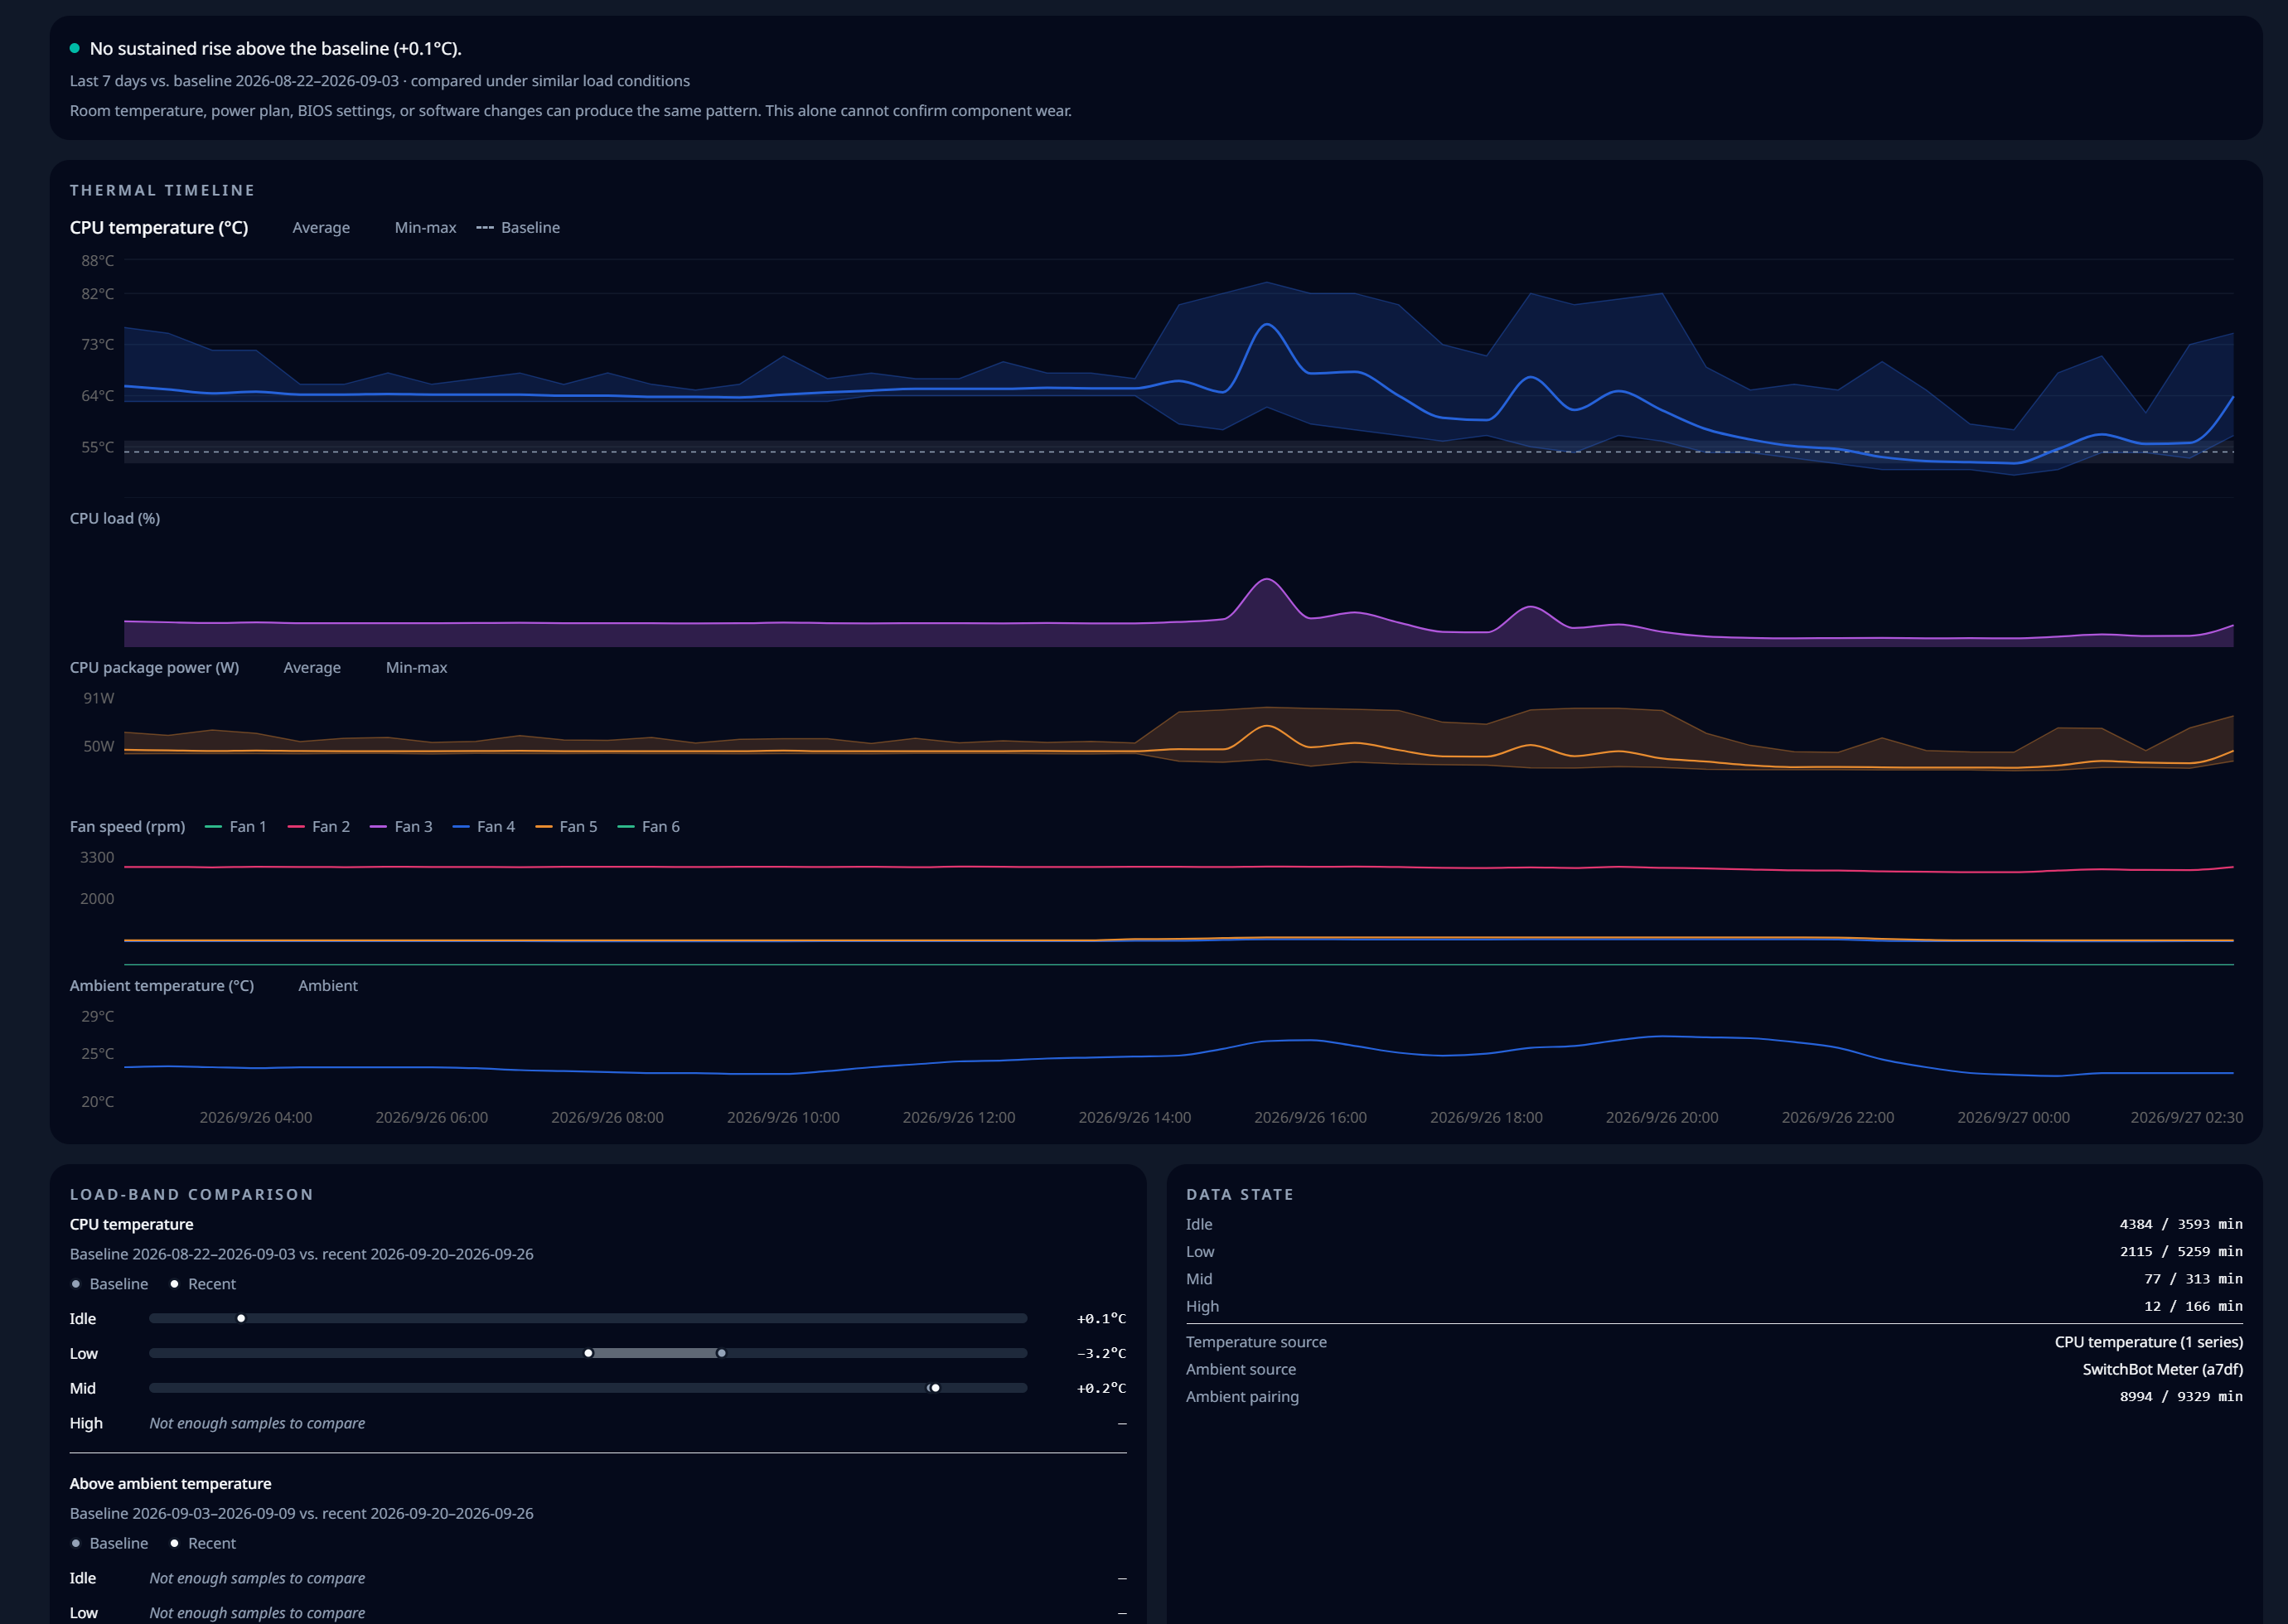
Cooling Insight dashboard showing temperature, load, power, and fan trends Cooling Insight dashboard showing temperature, load, power, and fan trends
Cooling Insight

Follow what changed at the same time.

After gaming or a long rendering job, review CPU temperature and load on a shared timeline. Available CPU package power and fan-speed readings add context to those changes.

Available readings depend on the OS and hardware. Unsupported sensors and periods without recorded data are identified separately.

CPU temperature
CPU load
CPU package powerOn supported hardware
Fan speedOn supported hardware

Illustrative timeline. Not an application screenshot or measured data.

See changes across days and months.

Switch between 24 hours, 7 days and 30 days of archive history, or 90-day and one-year views built from daily summaries. Compare recent idle temperatures with the established baseline to see sustained changes.

Archive history
24 hours / 7 days / 30 days
Daily summaries
90 days / 1 year

Views show the data you have recorded; a one-year view does not create a year of past readings.

Two updates to support that history.

This release adds Cooling Insight, updates history storage and makes optional sensor setup easier on Windows.

New installs use DuckDB for history

Fresh installs use DuckDB for history. Existing SQLite data can be moved through an explicit conversion flow. This update supports growing histories and longer-range aggregation.

History file size
History length SQLite(legacy format) DuckDB(new installs)
30 days 72.0MiB 16.9MiB
90 days 216.3MiB 50.1MiB
1 year 883.3MiB 202.7MiB

Synthetic-data comparison: the DuckDB column shows the median across 3 builds, about 76–77% smaller. These are not whole-application database sizes.

About the storage update

DuckDB is a column-oriented database designed for analytical queries. On new installs and after conversion, it stores and aggregates HardwareVisualizer history, including records used by Cooling Insight. It does not require a separate database server.

Measured on September 27, 2026, using synthetic Process Stats and Ambient histories (stable cases, 15 process samples per minute). The table shows the median DuckDB file size across 3 independent builds; observed ranges: 30 days 16.9–17.1MiB; 90 days 50.1–50.2MiB; 1 year 202.5–202.8MiB. File sizes were measured after closing and checkpointing: SQLite includes indexes; DuckDB includes metadata and WAL, with no explicit indexes or primary-key constraints in this fixture. Environment: macOS 26.6.2; SQLite 3.46.0 / DuckDB 1.5.5. This reruns the historical engine experiment; it does not measure final application storage or migration overhead.

Measurement conditions and results (JSON)

Install PawnIO from Settings

On Windows, start optional PawnIO installation from HardwareVisualizer. The app downloads the runtime and required modules, reducing manual setup for supported CPU temperature, power and motherboard sensor readings.

Optional, Windows only. Requires an internet connection and Windows administrator approval. Sensor availability depends on the hardware.

What happens during installation?

In Settings → Advanced → Optional component setup, choose Install. Downloads come from the official GitHub releases and are checked against recorded sizes and SHA-256 hashes. The app requests Windows administrator approval, installs a missing runtime, and adds or updates required modules. Restart HardwareVisualizer afterward; restart Windows first if requested. PawnIO is downloaded during setup, not bundled with HardwareVisualizer.

Questions & answers

Do comparisons need time to collect data?

Yes. Cooling Insight needs recorded data to establish a baseline and compare it with recent readings. It shows baseline progress and leaves comparisons unavailable when there are not enough samples.

Does Cooling Insight adjust my fans?

The features introduced here display and compare recorded readings. They do not change fan curves or cooling settings.

Is PawnIO required on every OS?

No. PawnIO setup is for supported sensor paths on Windows. It is not a setup step for macOS or Linux, and installing it does not make every sensor available.

Review your CPU’s thermal history.

Use Cooling Insight to review CPU temperature alongside load and compare it with past readings. DuckDB history storage and optional PawnIO setup support this update.