Logo HardwareVisualizer

Cross-platform CPU & GPU hardware monitor

See what made your PC hot or slow.

HardwareVisualizer is a cross-platform hardware monitor for CPU, GPU, temperature, and process activity. Review what happened after gaming or heavy workloads—even when you were not watching the live graphs.

For Windows 10 and 11. Also available on macOS and Linux.

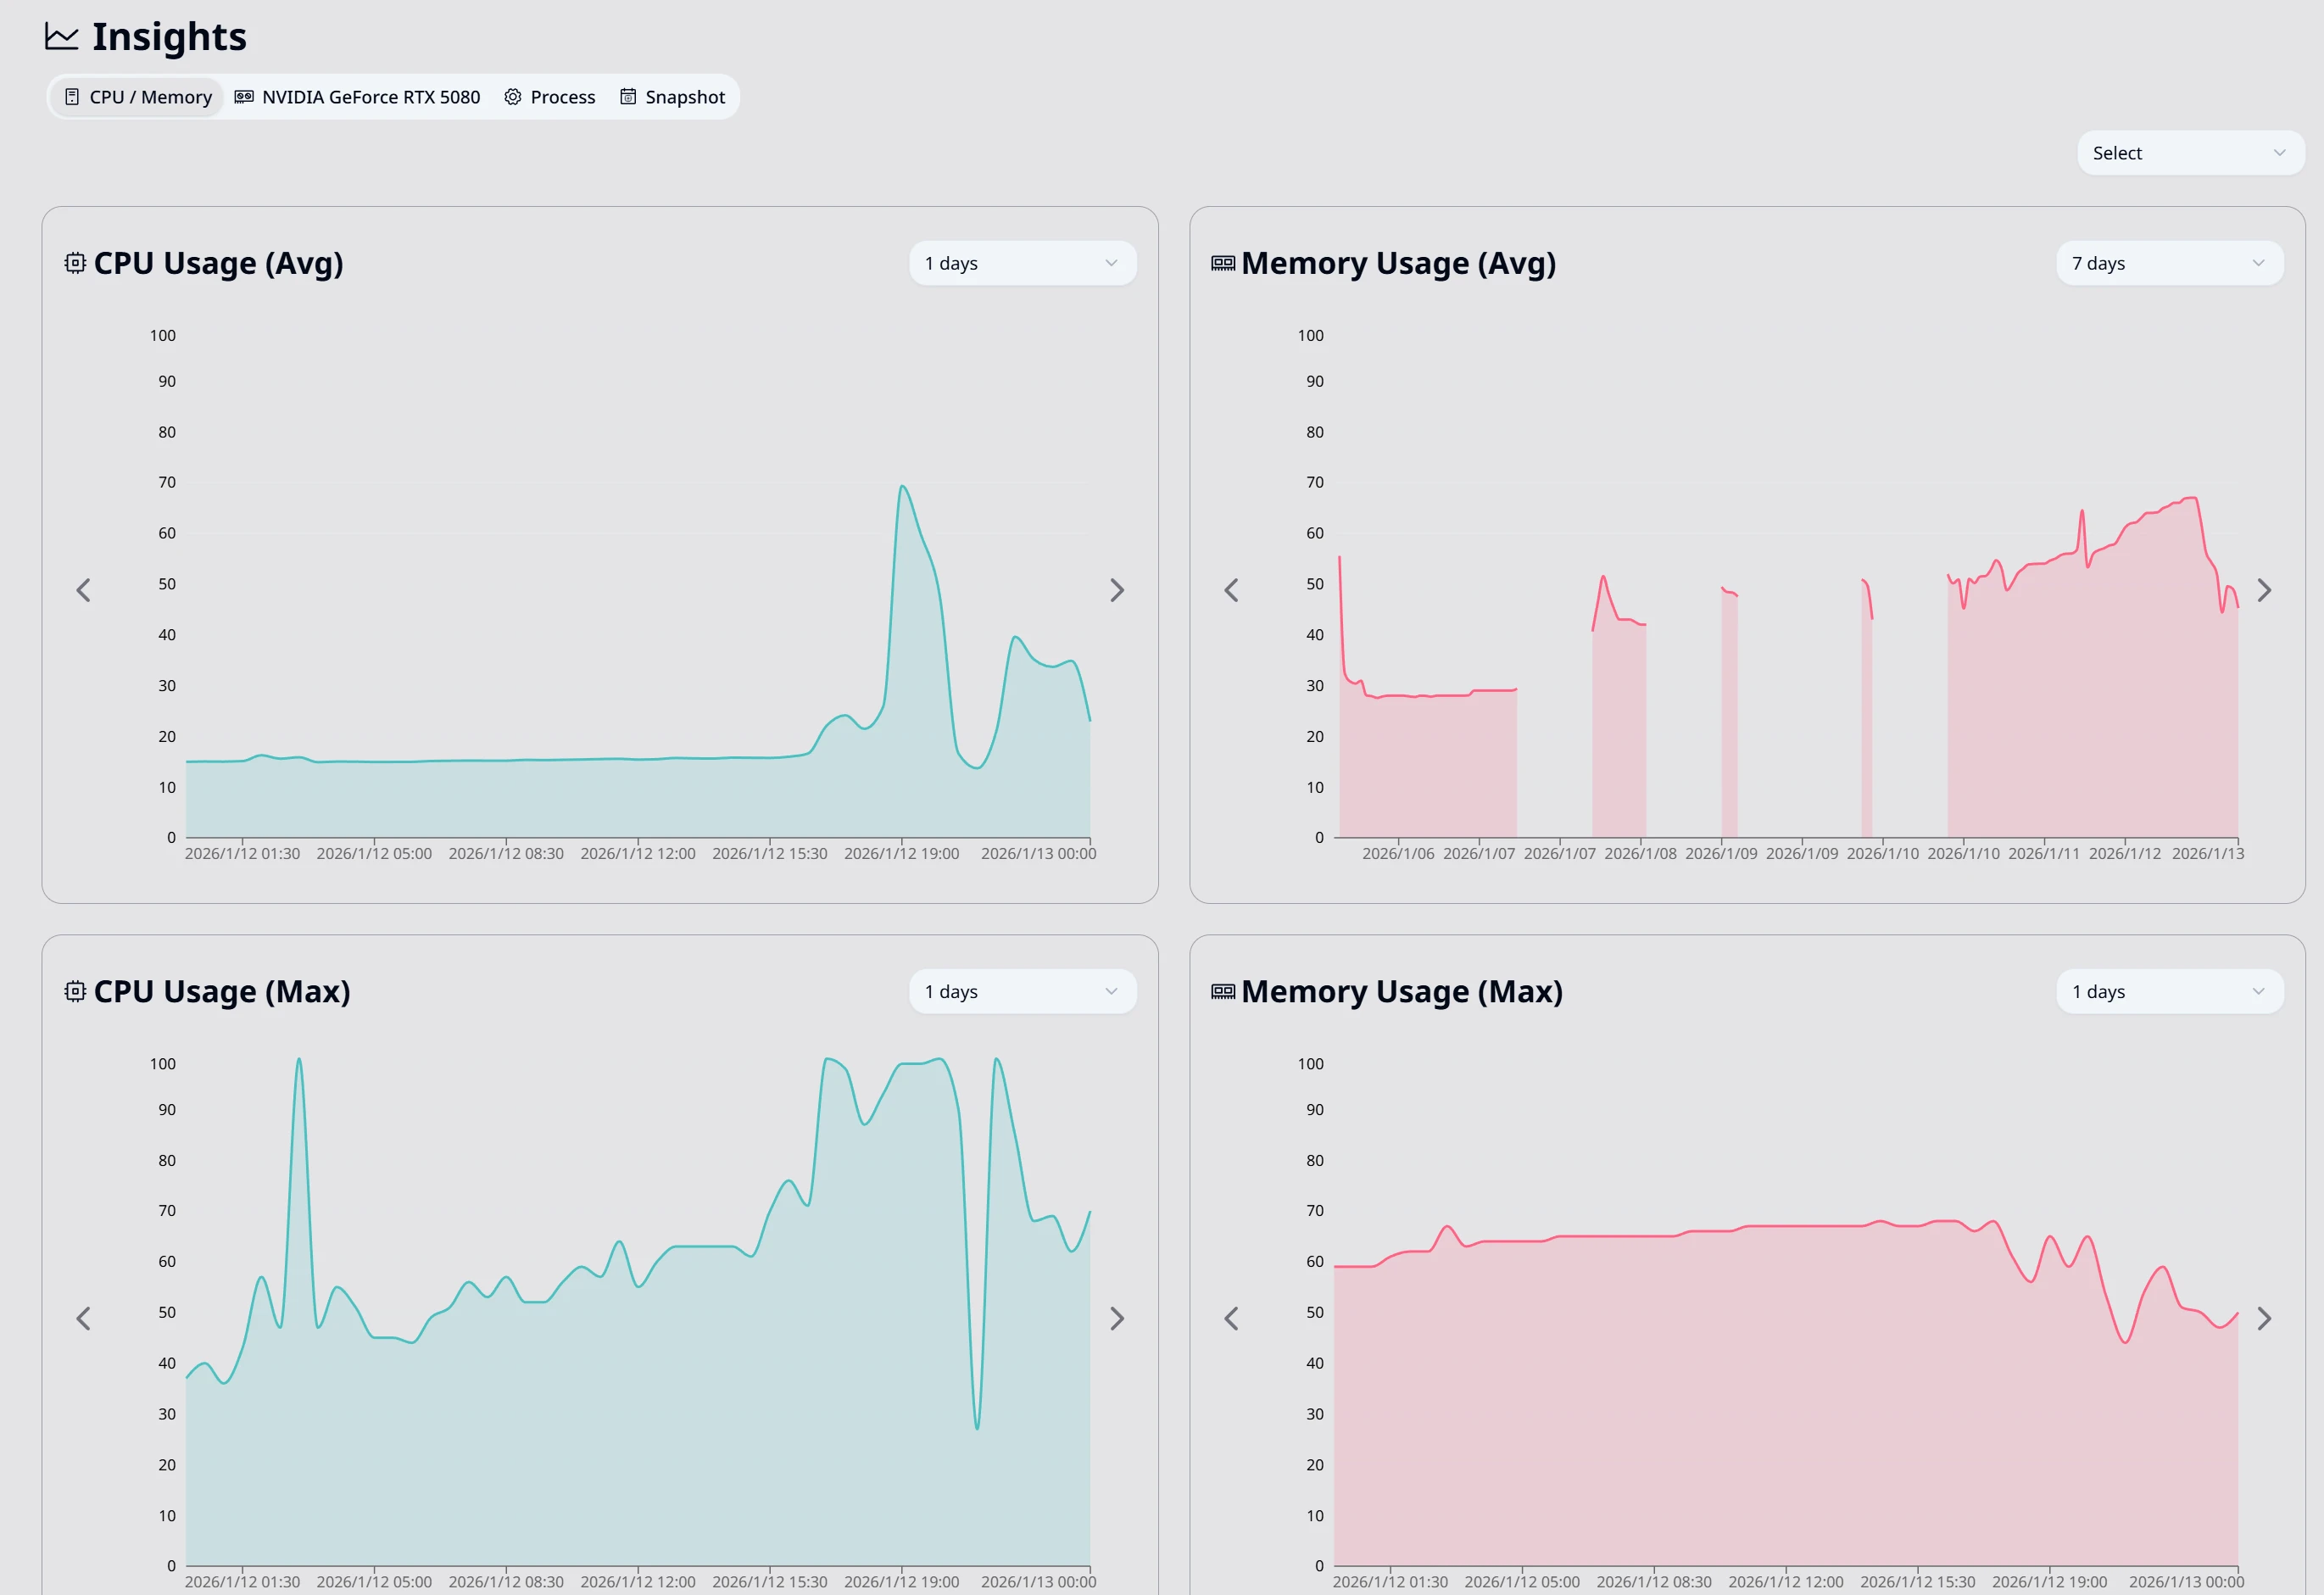
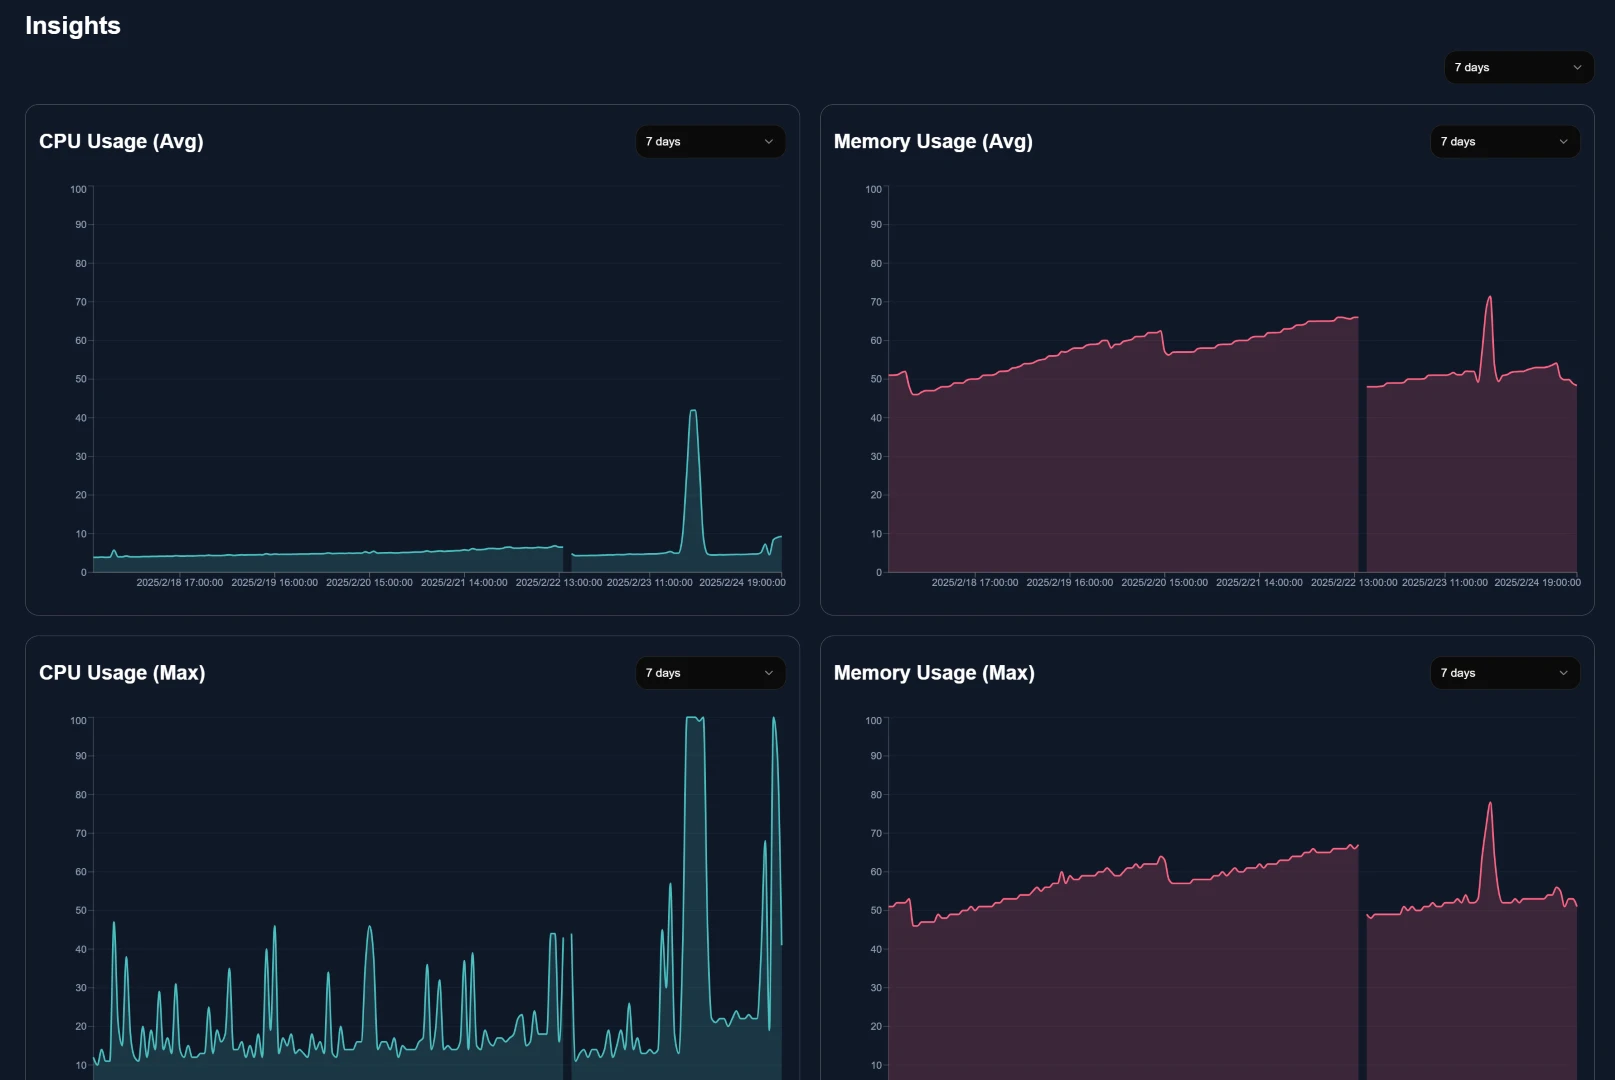
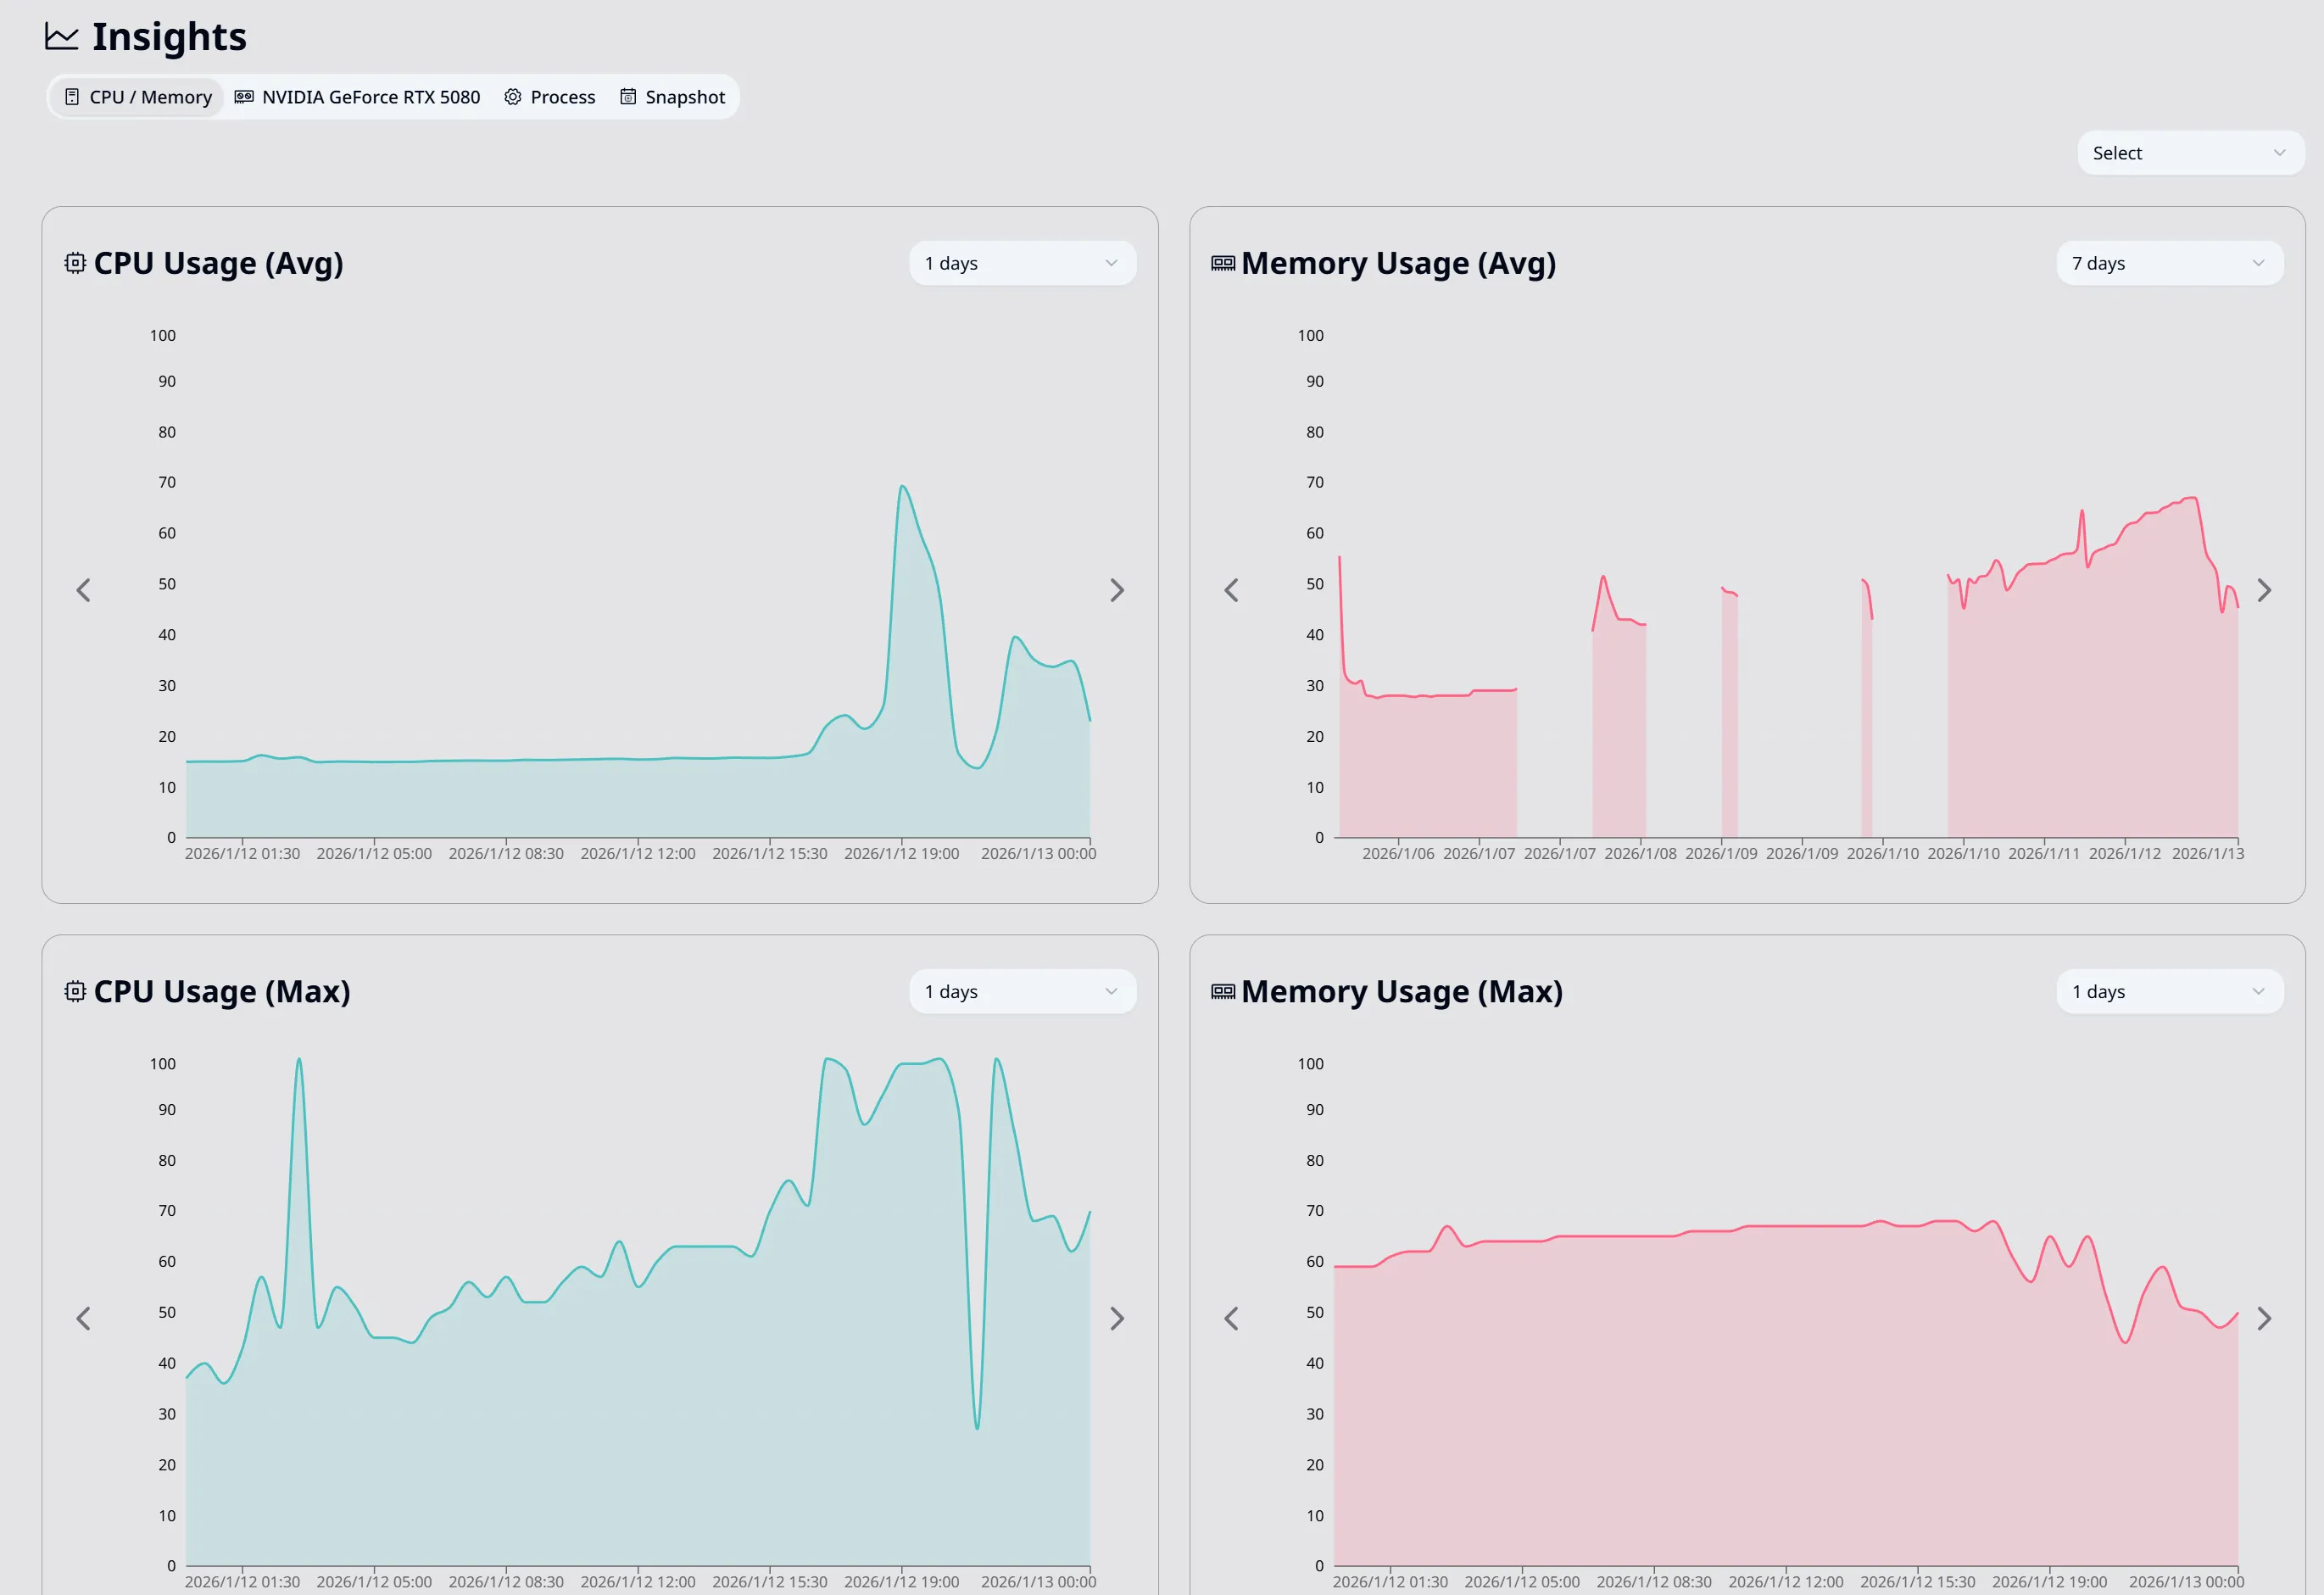
Insights: review what happened 30 days by default
  • No account
  • No telemetry
  • Open source
  • Signed Windows installer

Look Back After the Workload Ends

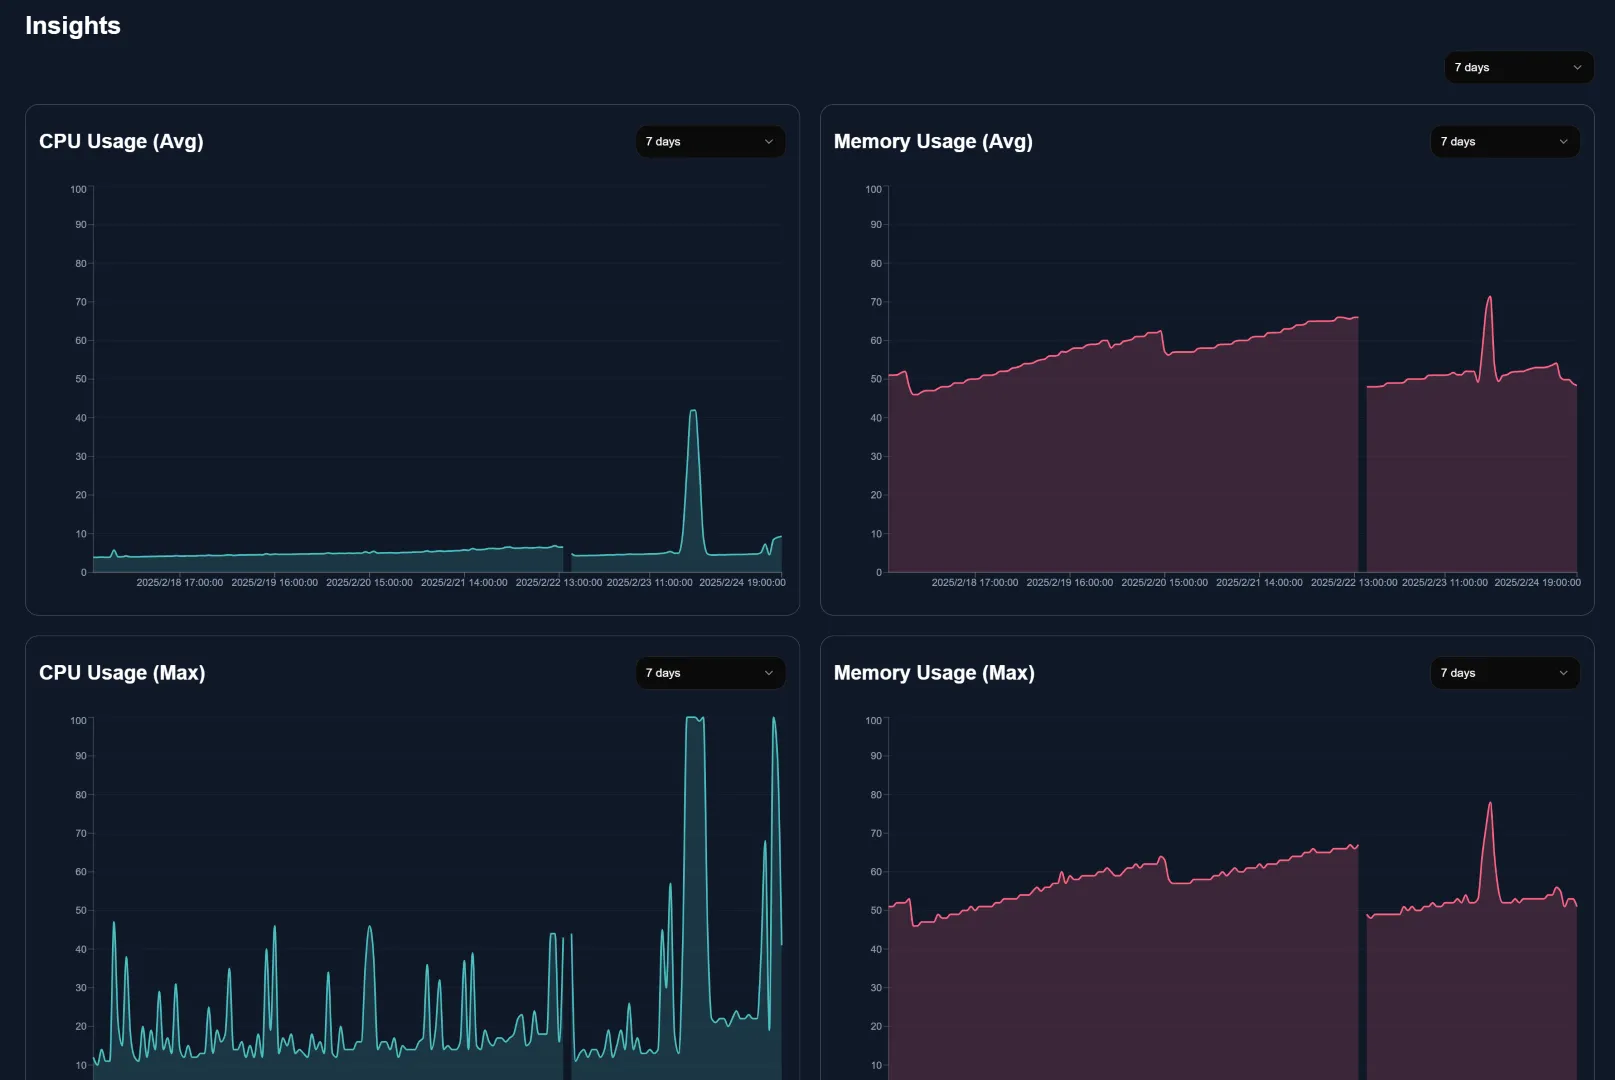
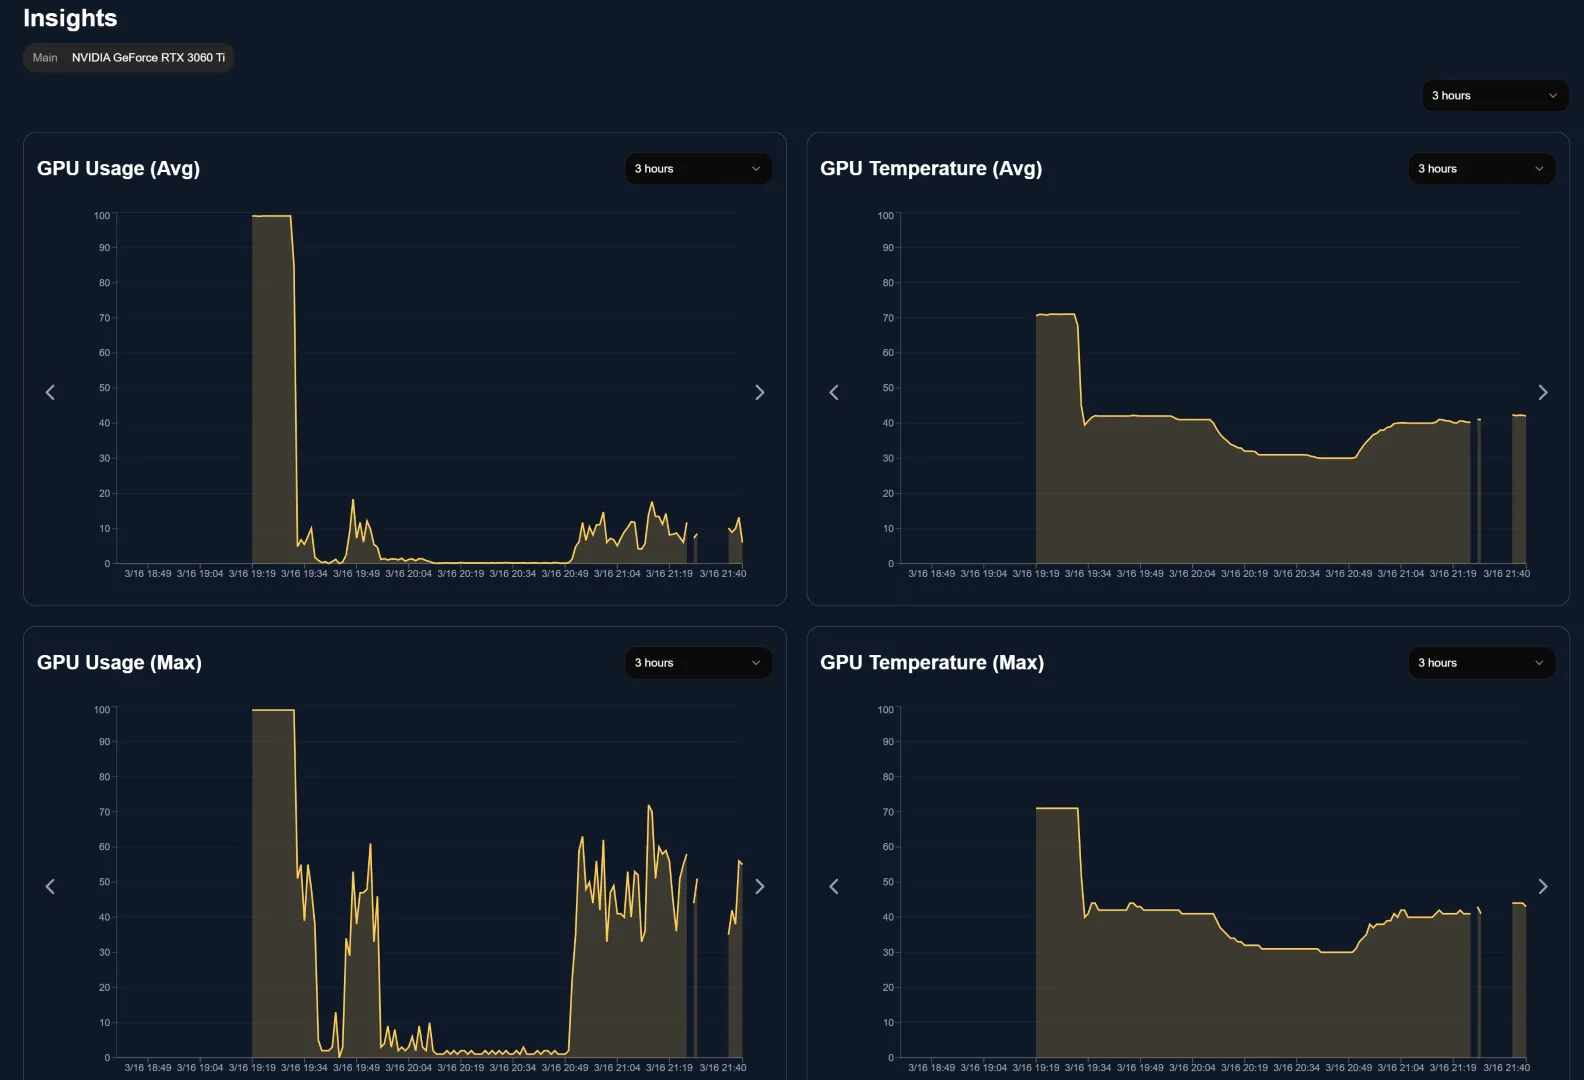
You do not have to watch a live graph while you play, render, compile, or run another demanding task. Open Insights afterward to see when load peaked, temperatures rose, or a process used more resources. History is kept for 30 days by default, and retention is configurable.

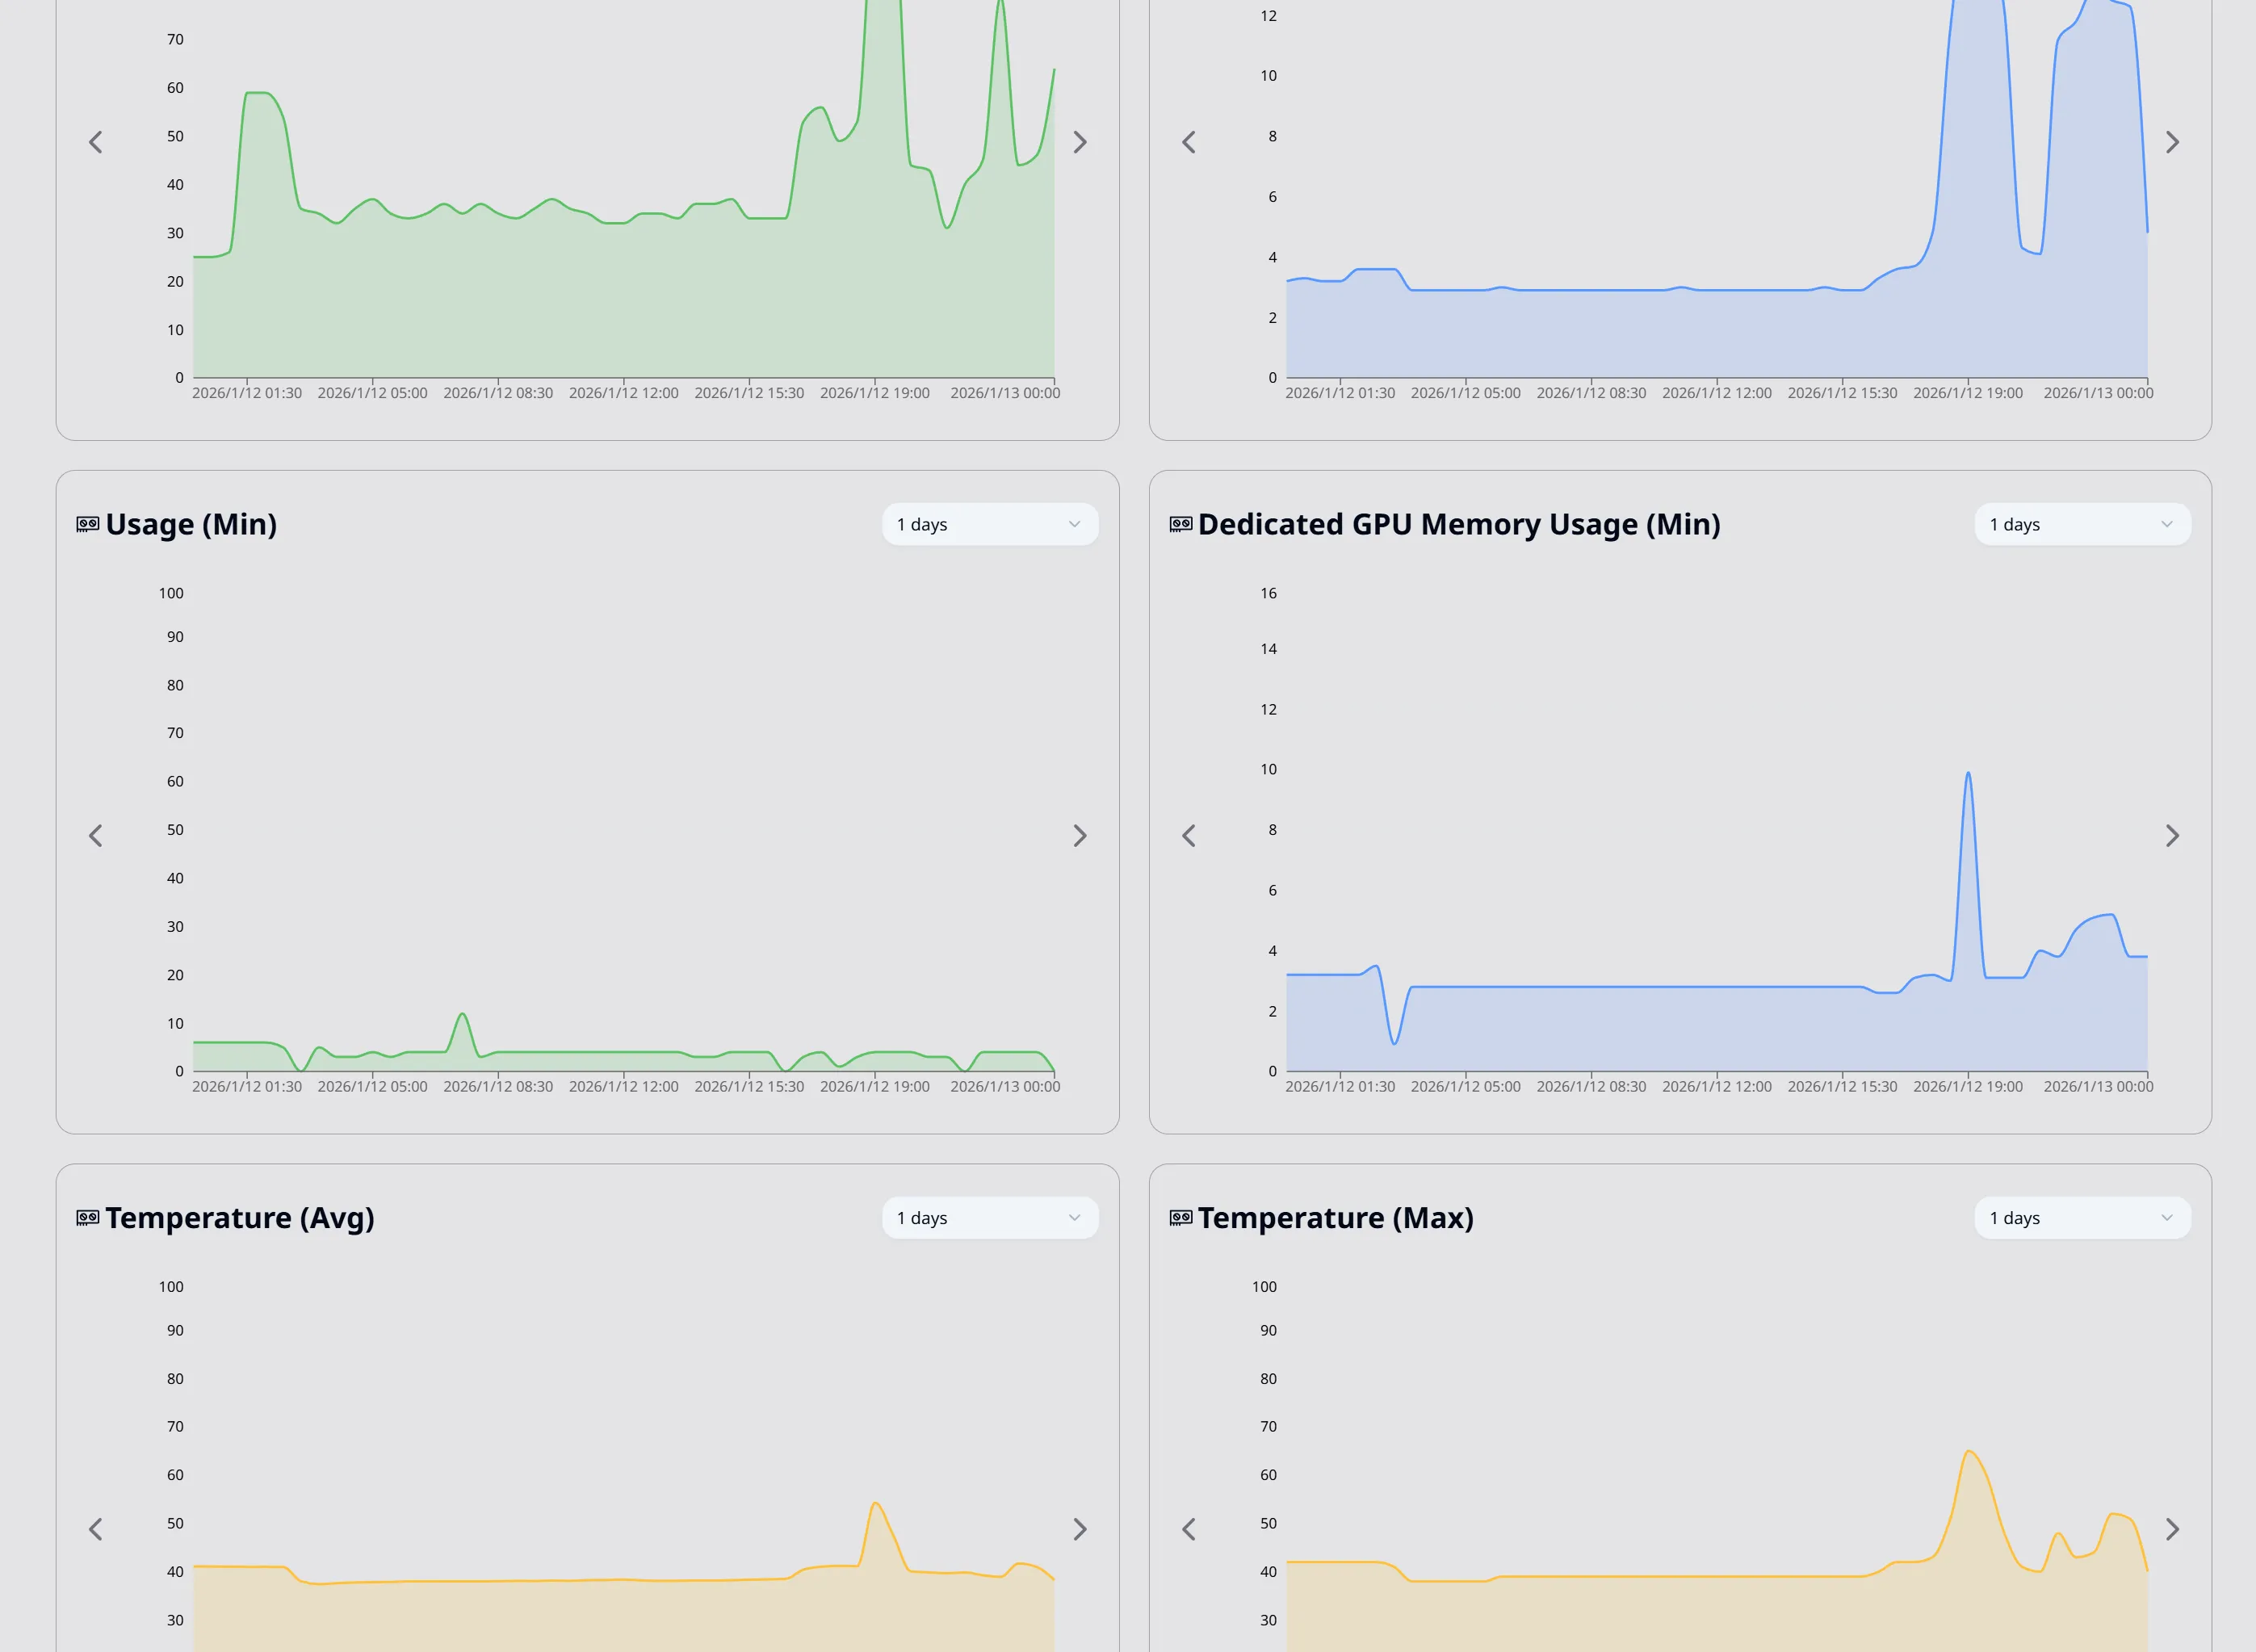
Check Peaks During Gaming

See when CPU or GPU load peaked and how long demanding activity continued.

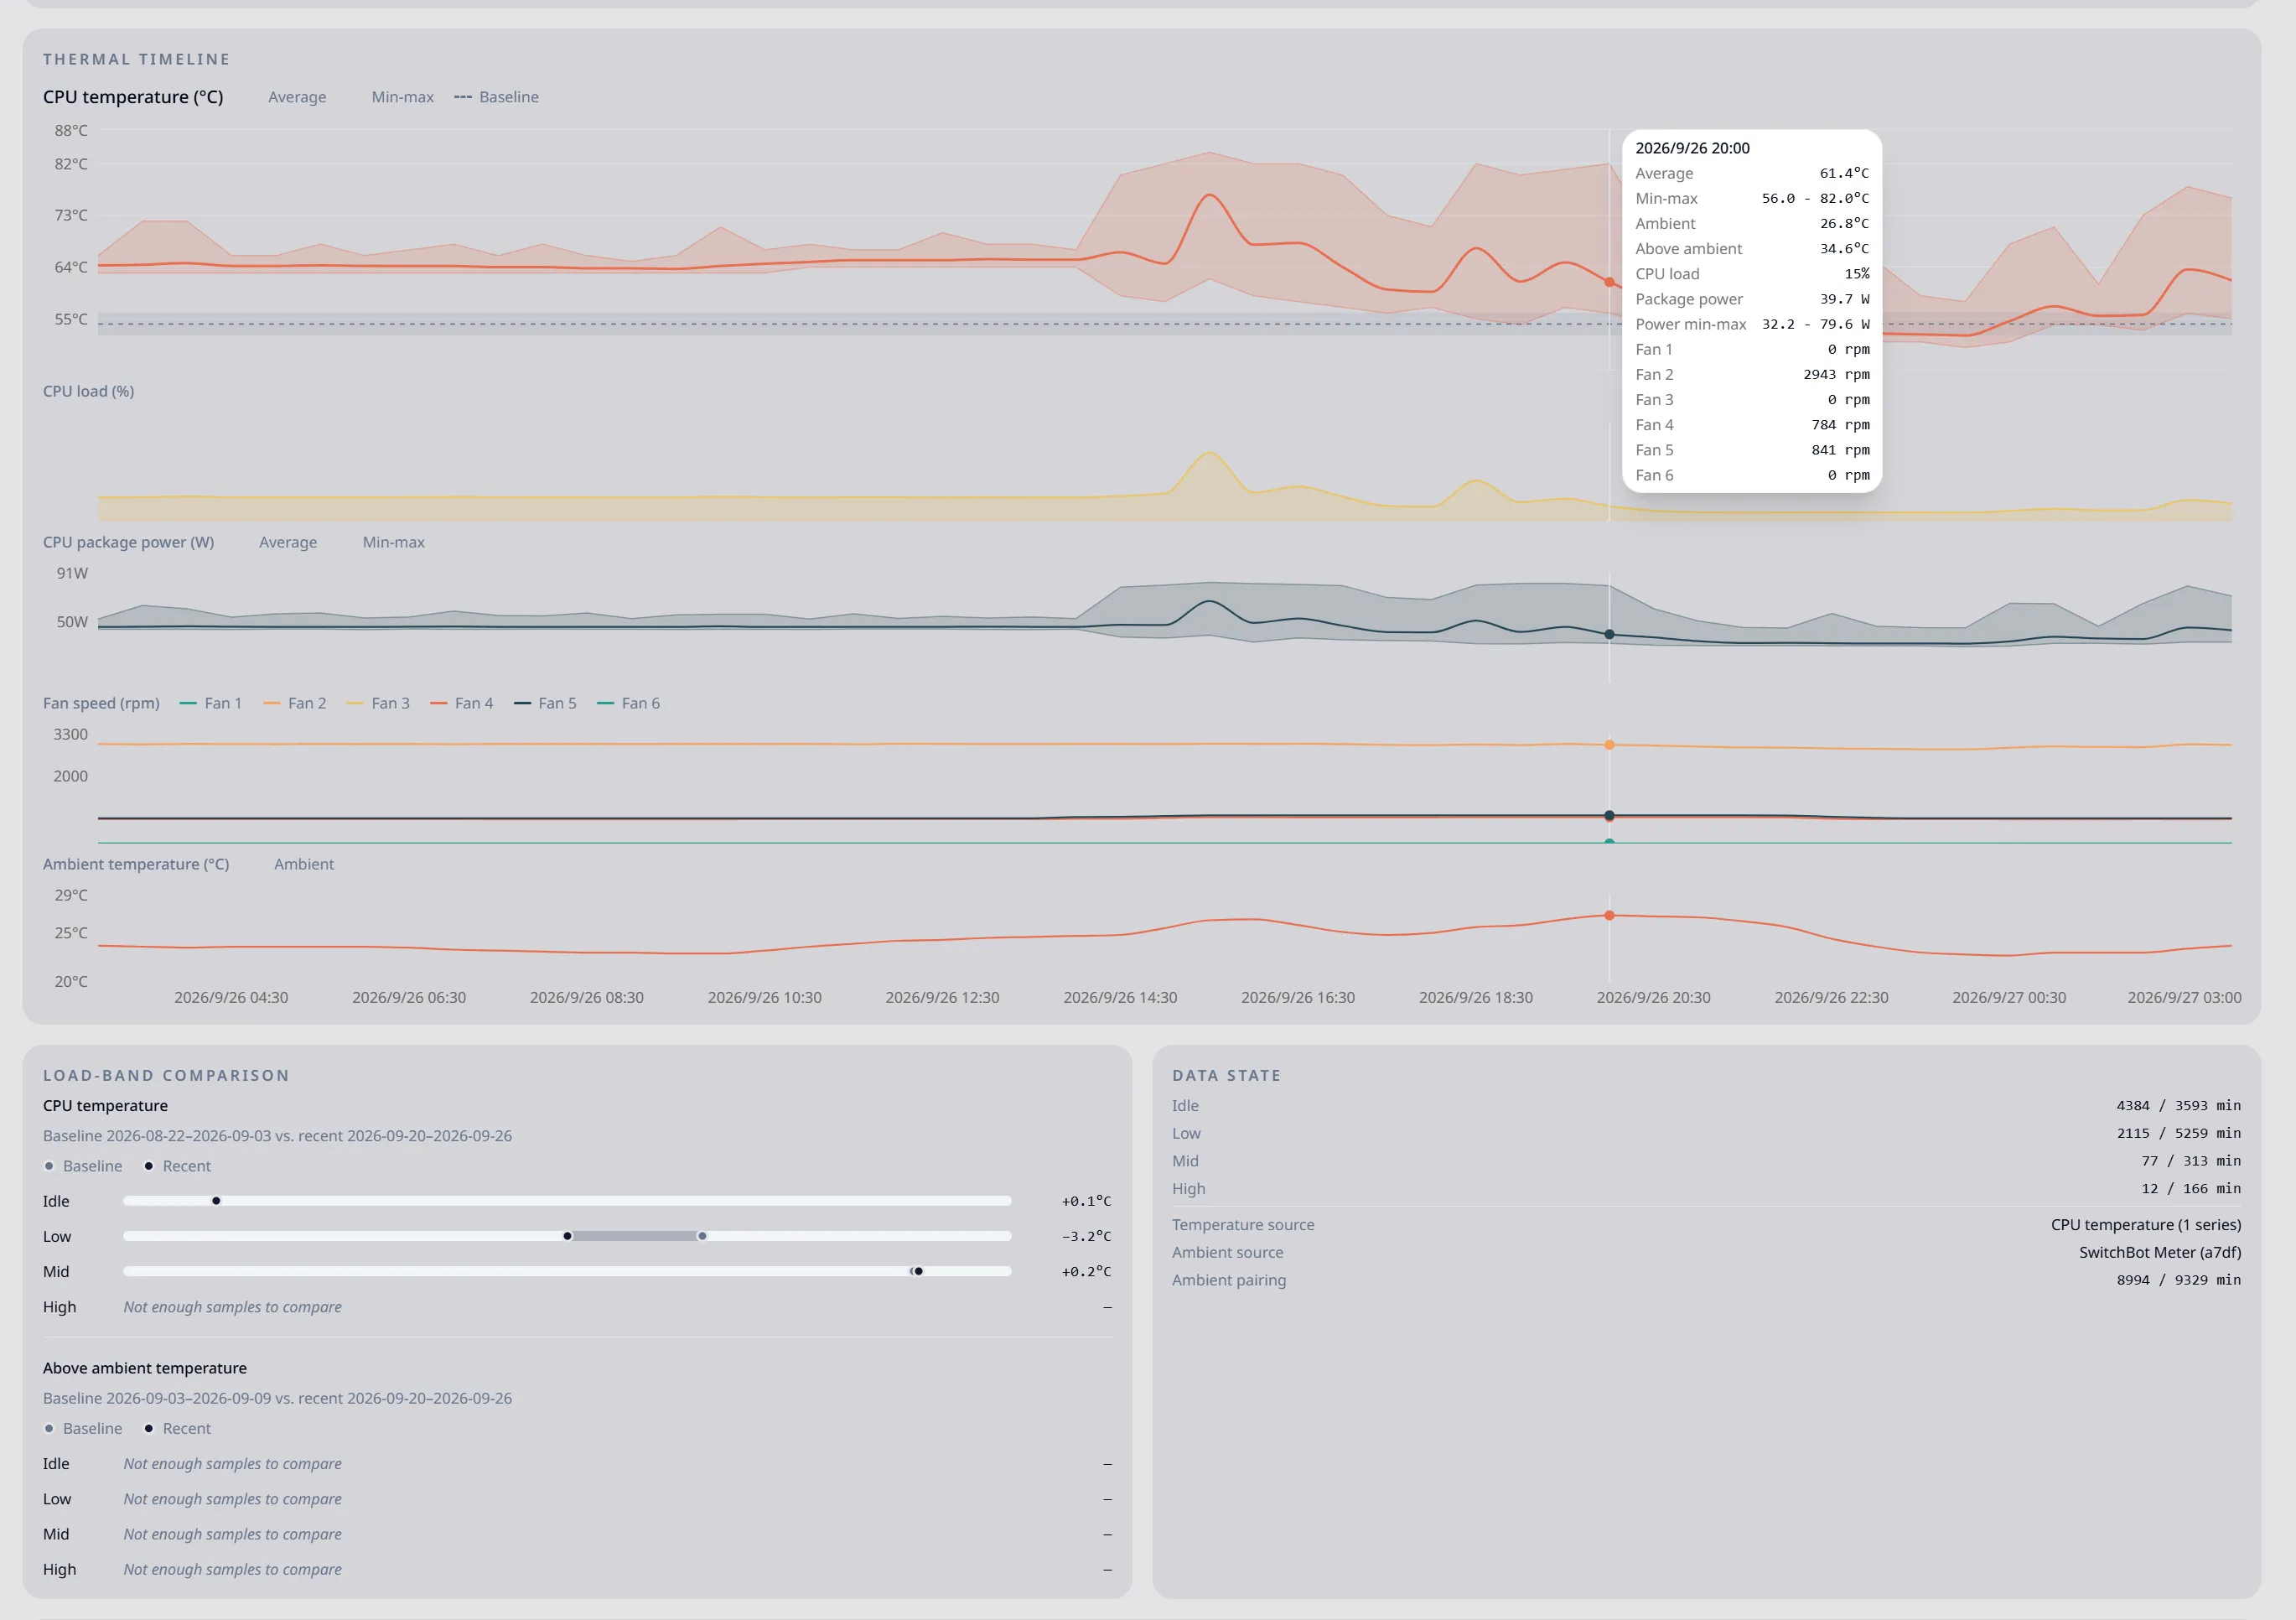
Trace Temperature Rises

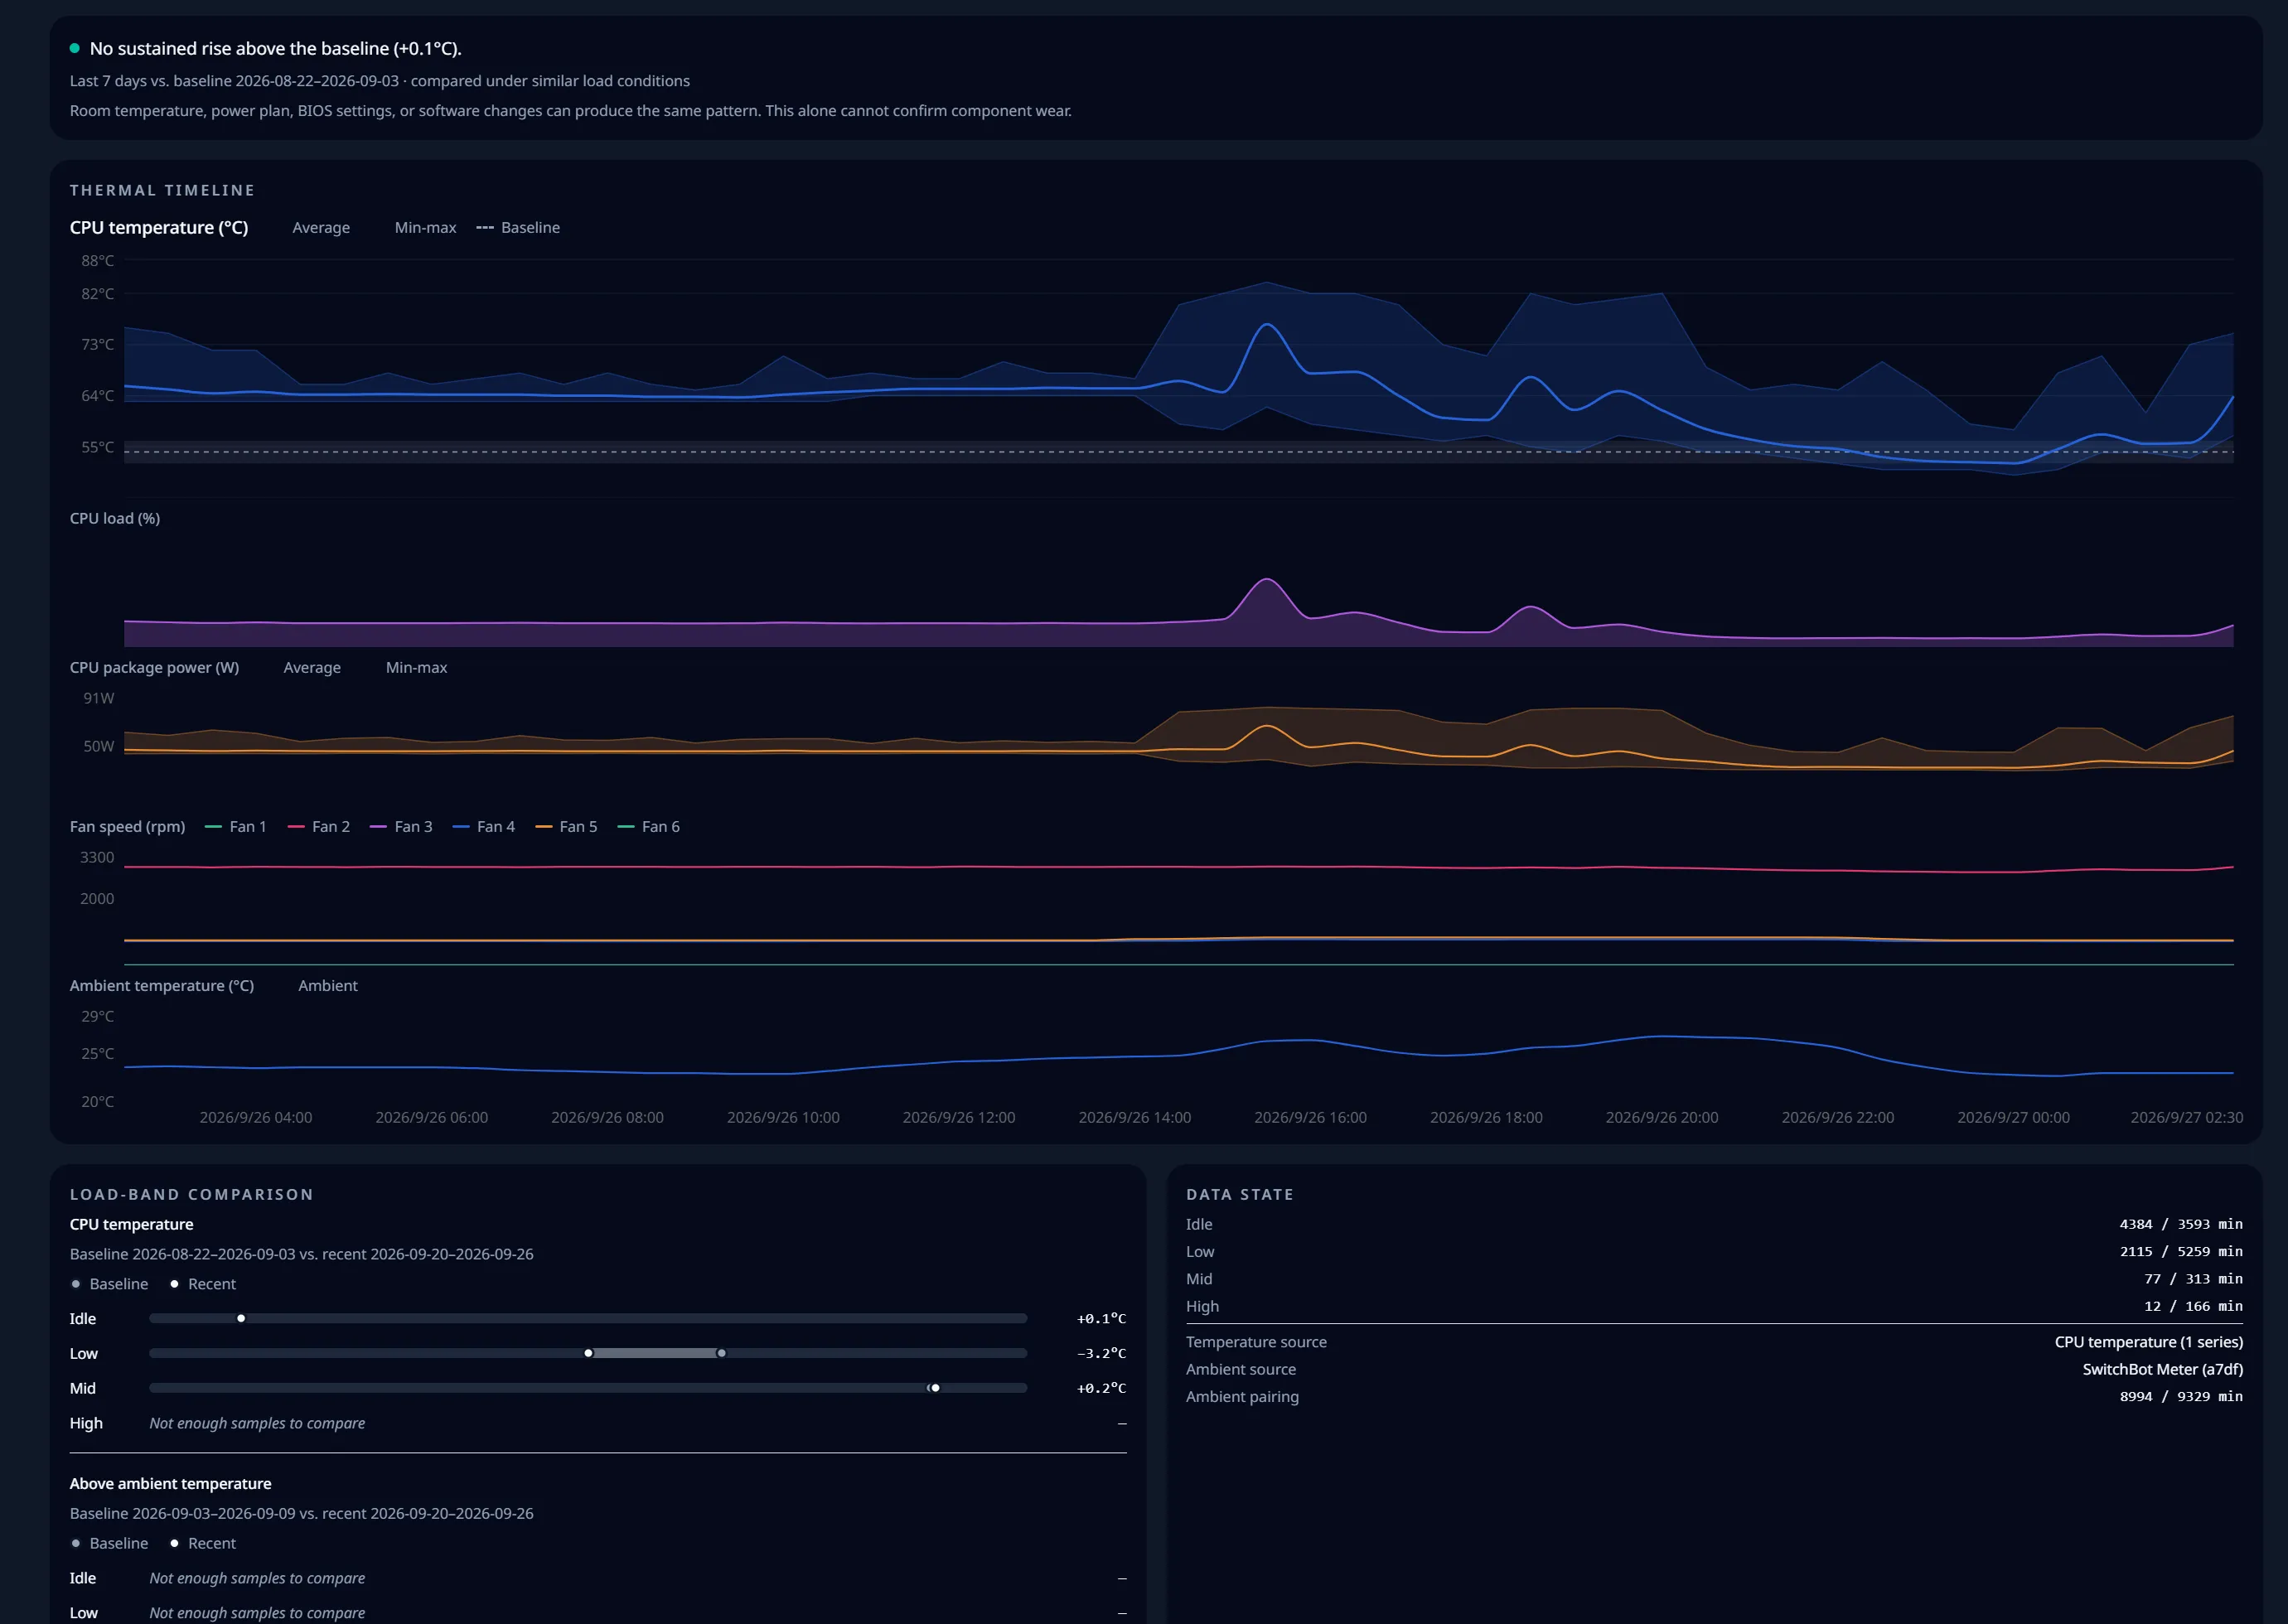
Follow temperature changes over time and see how they relate to CPU or GPU load.

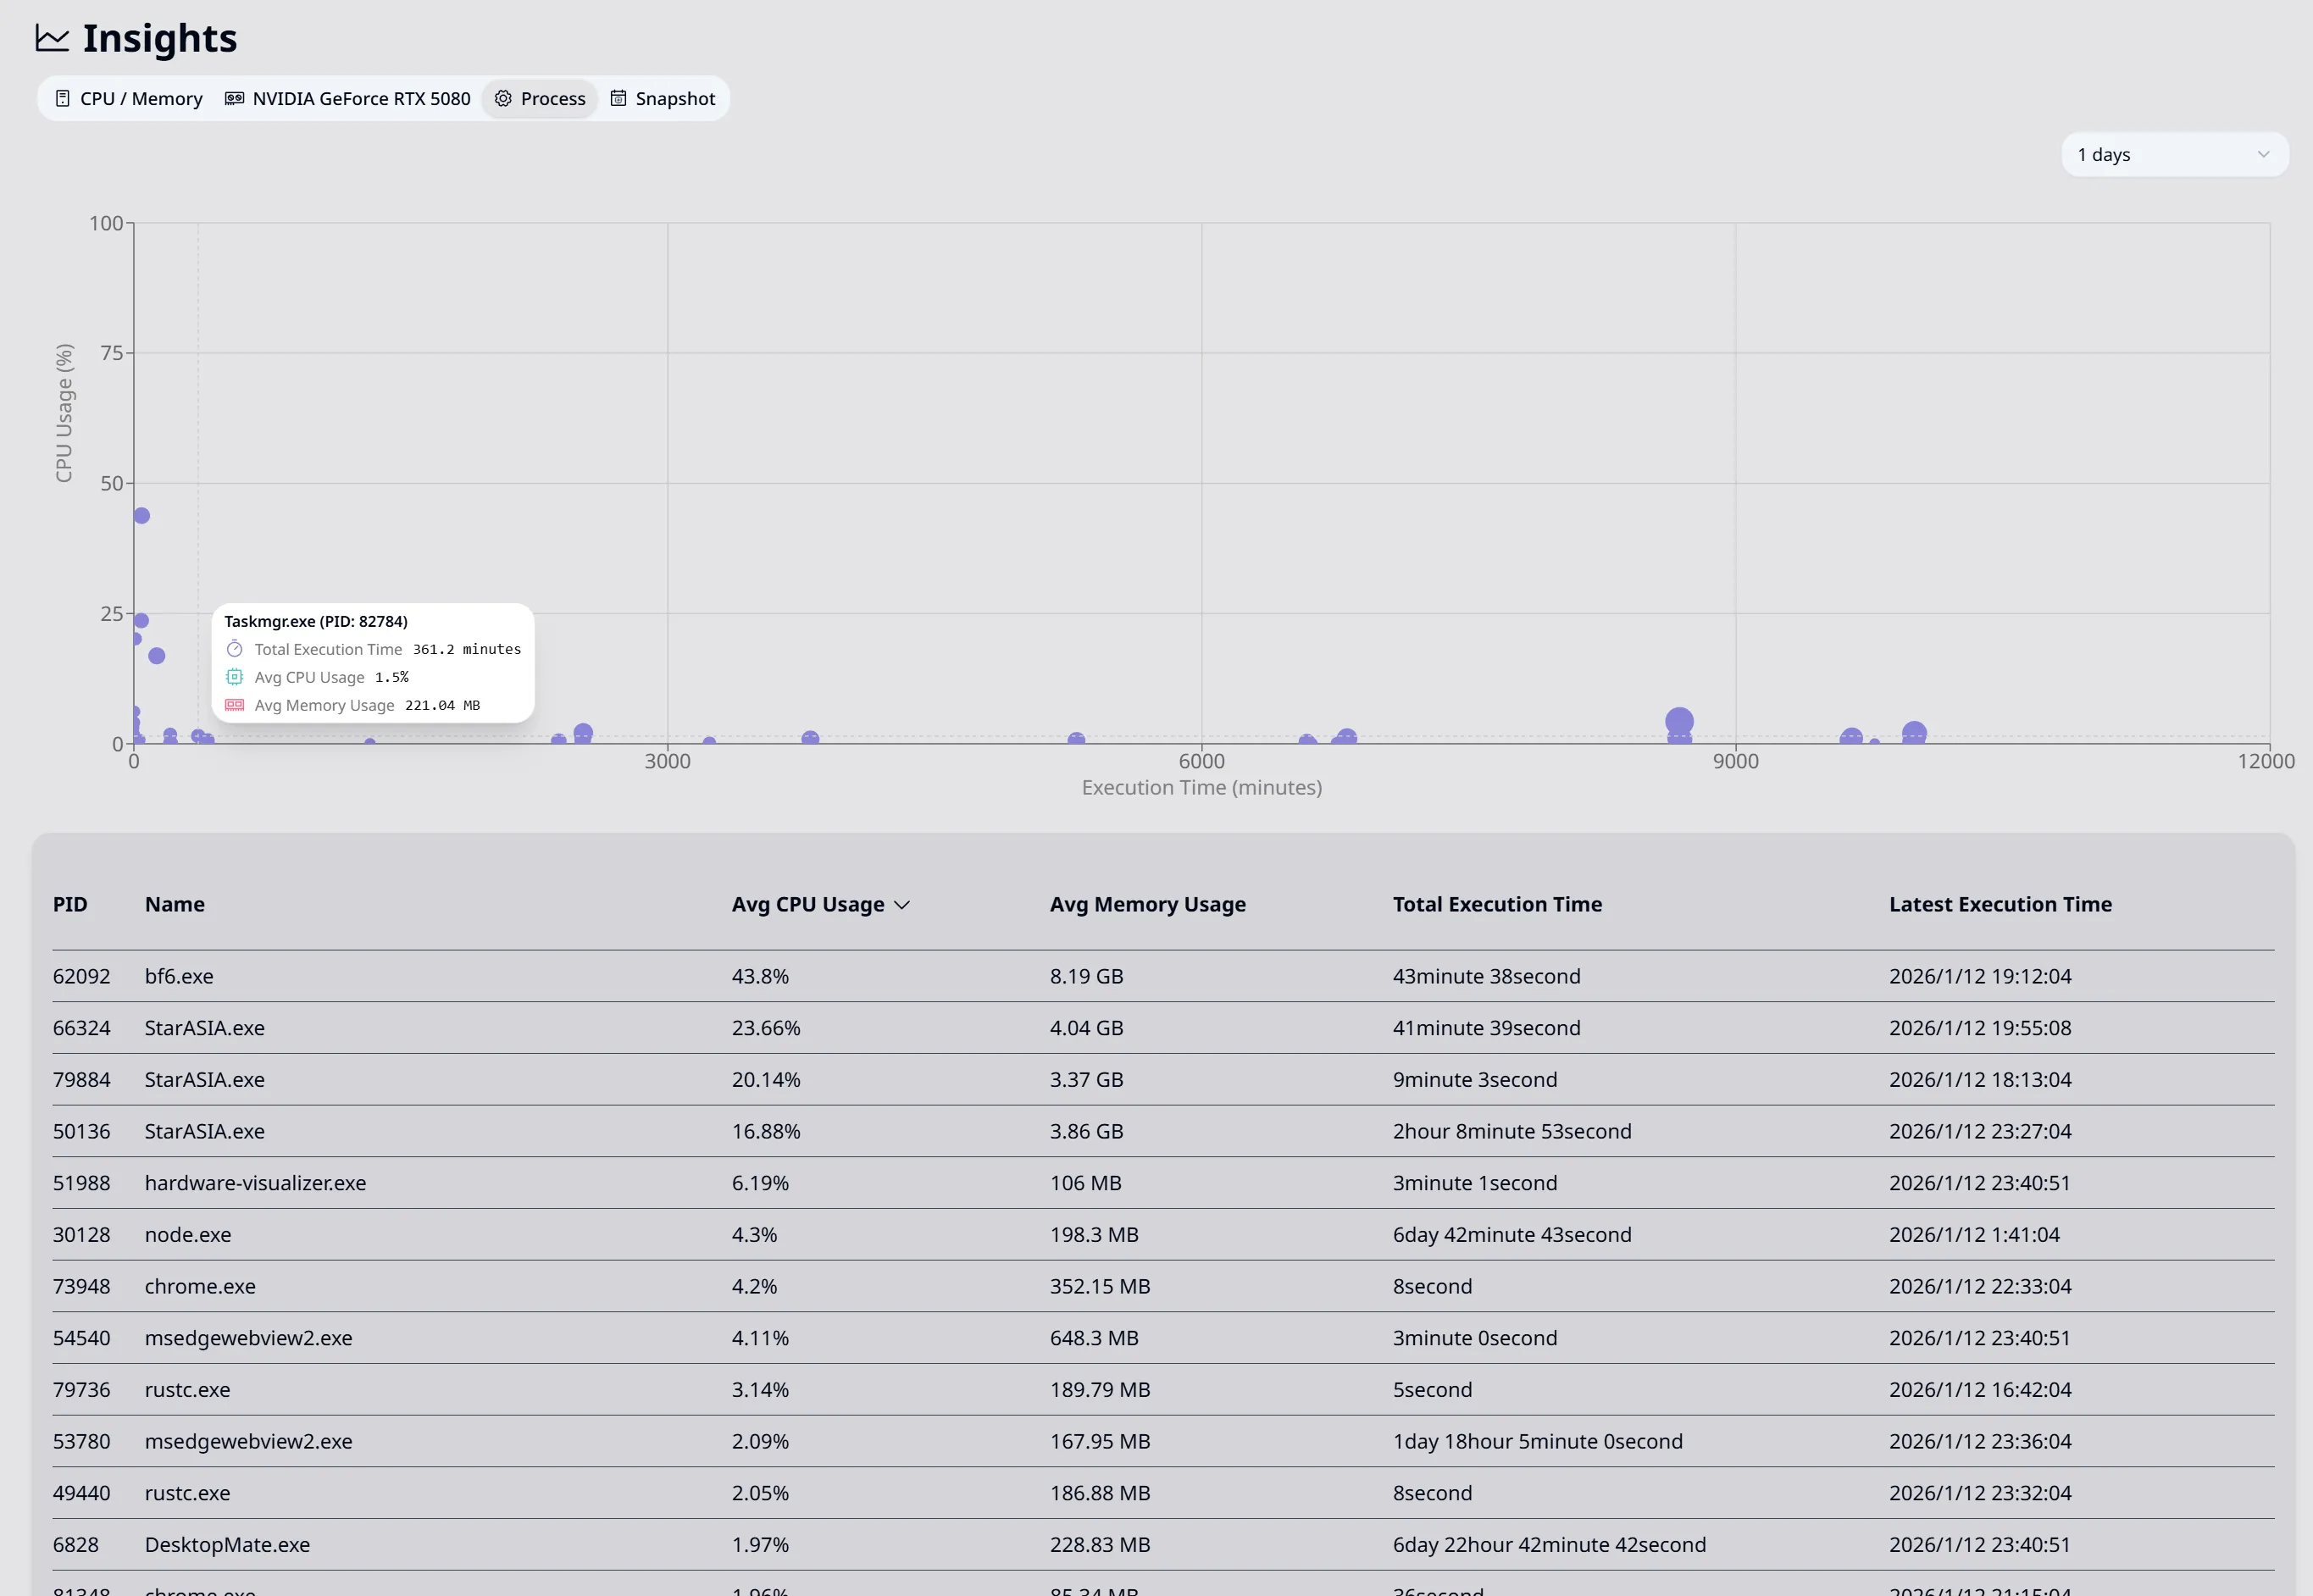
Find the Process Behind the Load

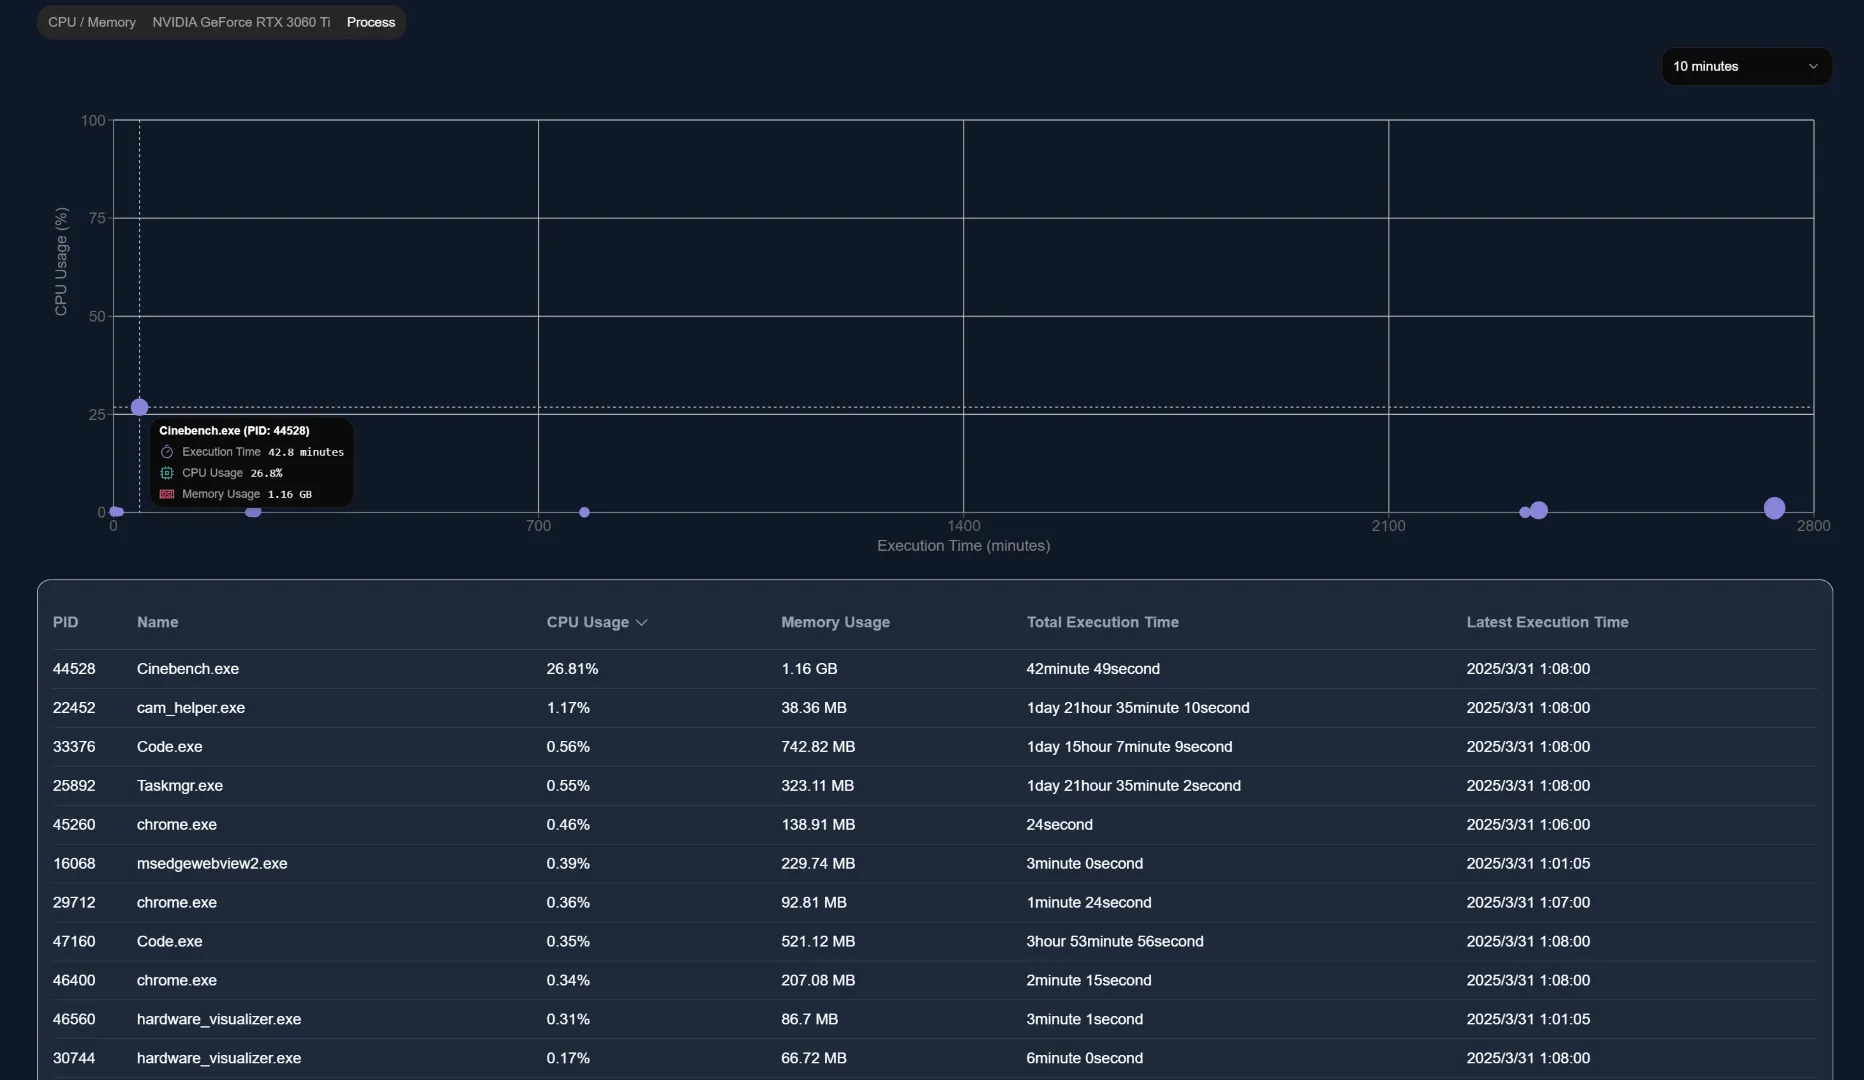
Review sampled process activity to see which applications used CPU or memory.

Compare Earlier Periods

Return to an earlier period and compare the same CPU, GPU, and temperature metrics with what you see now.

Live Details When You Need Them

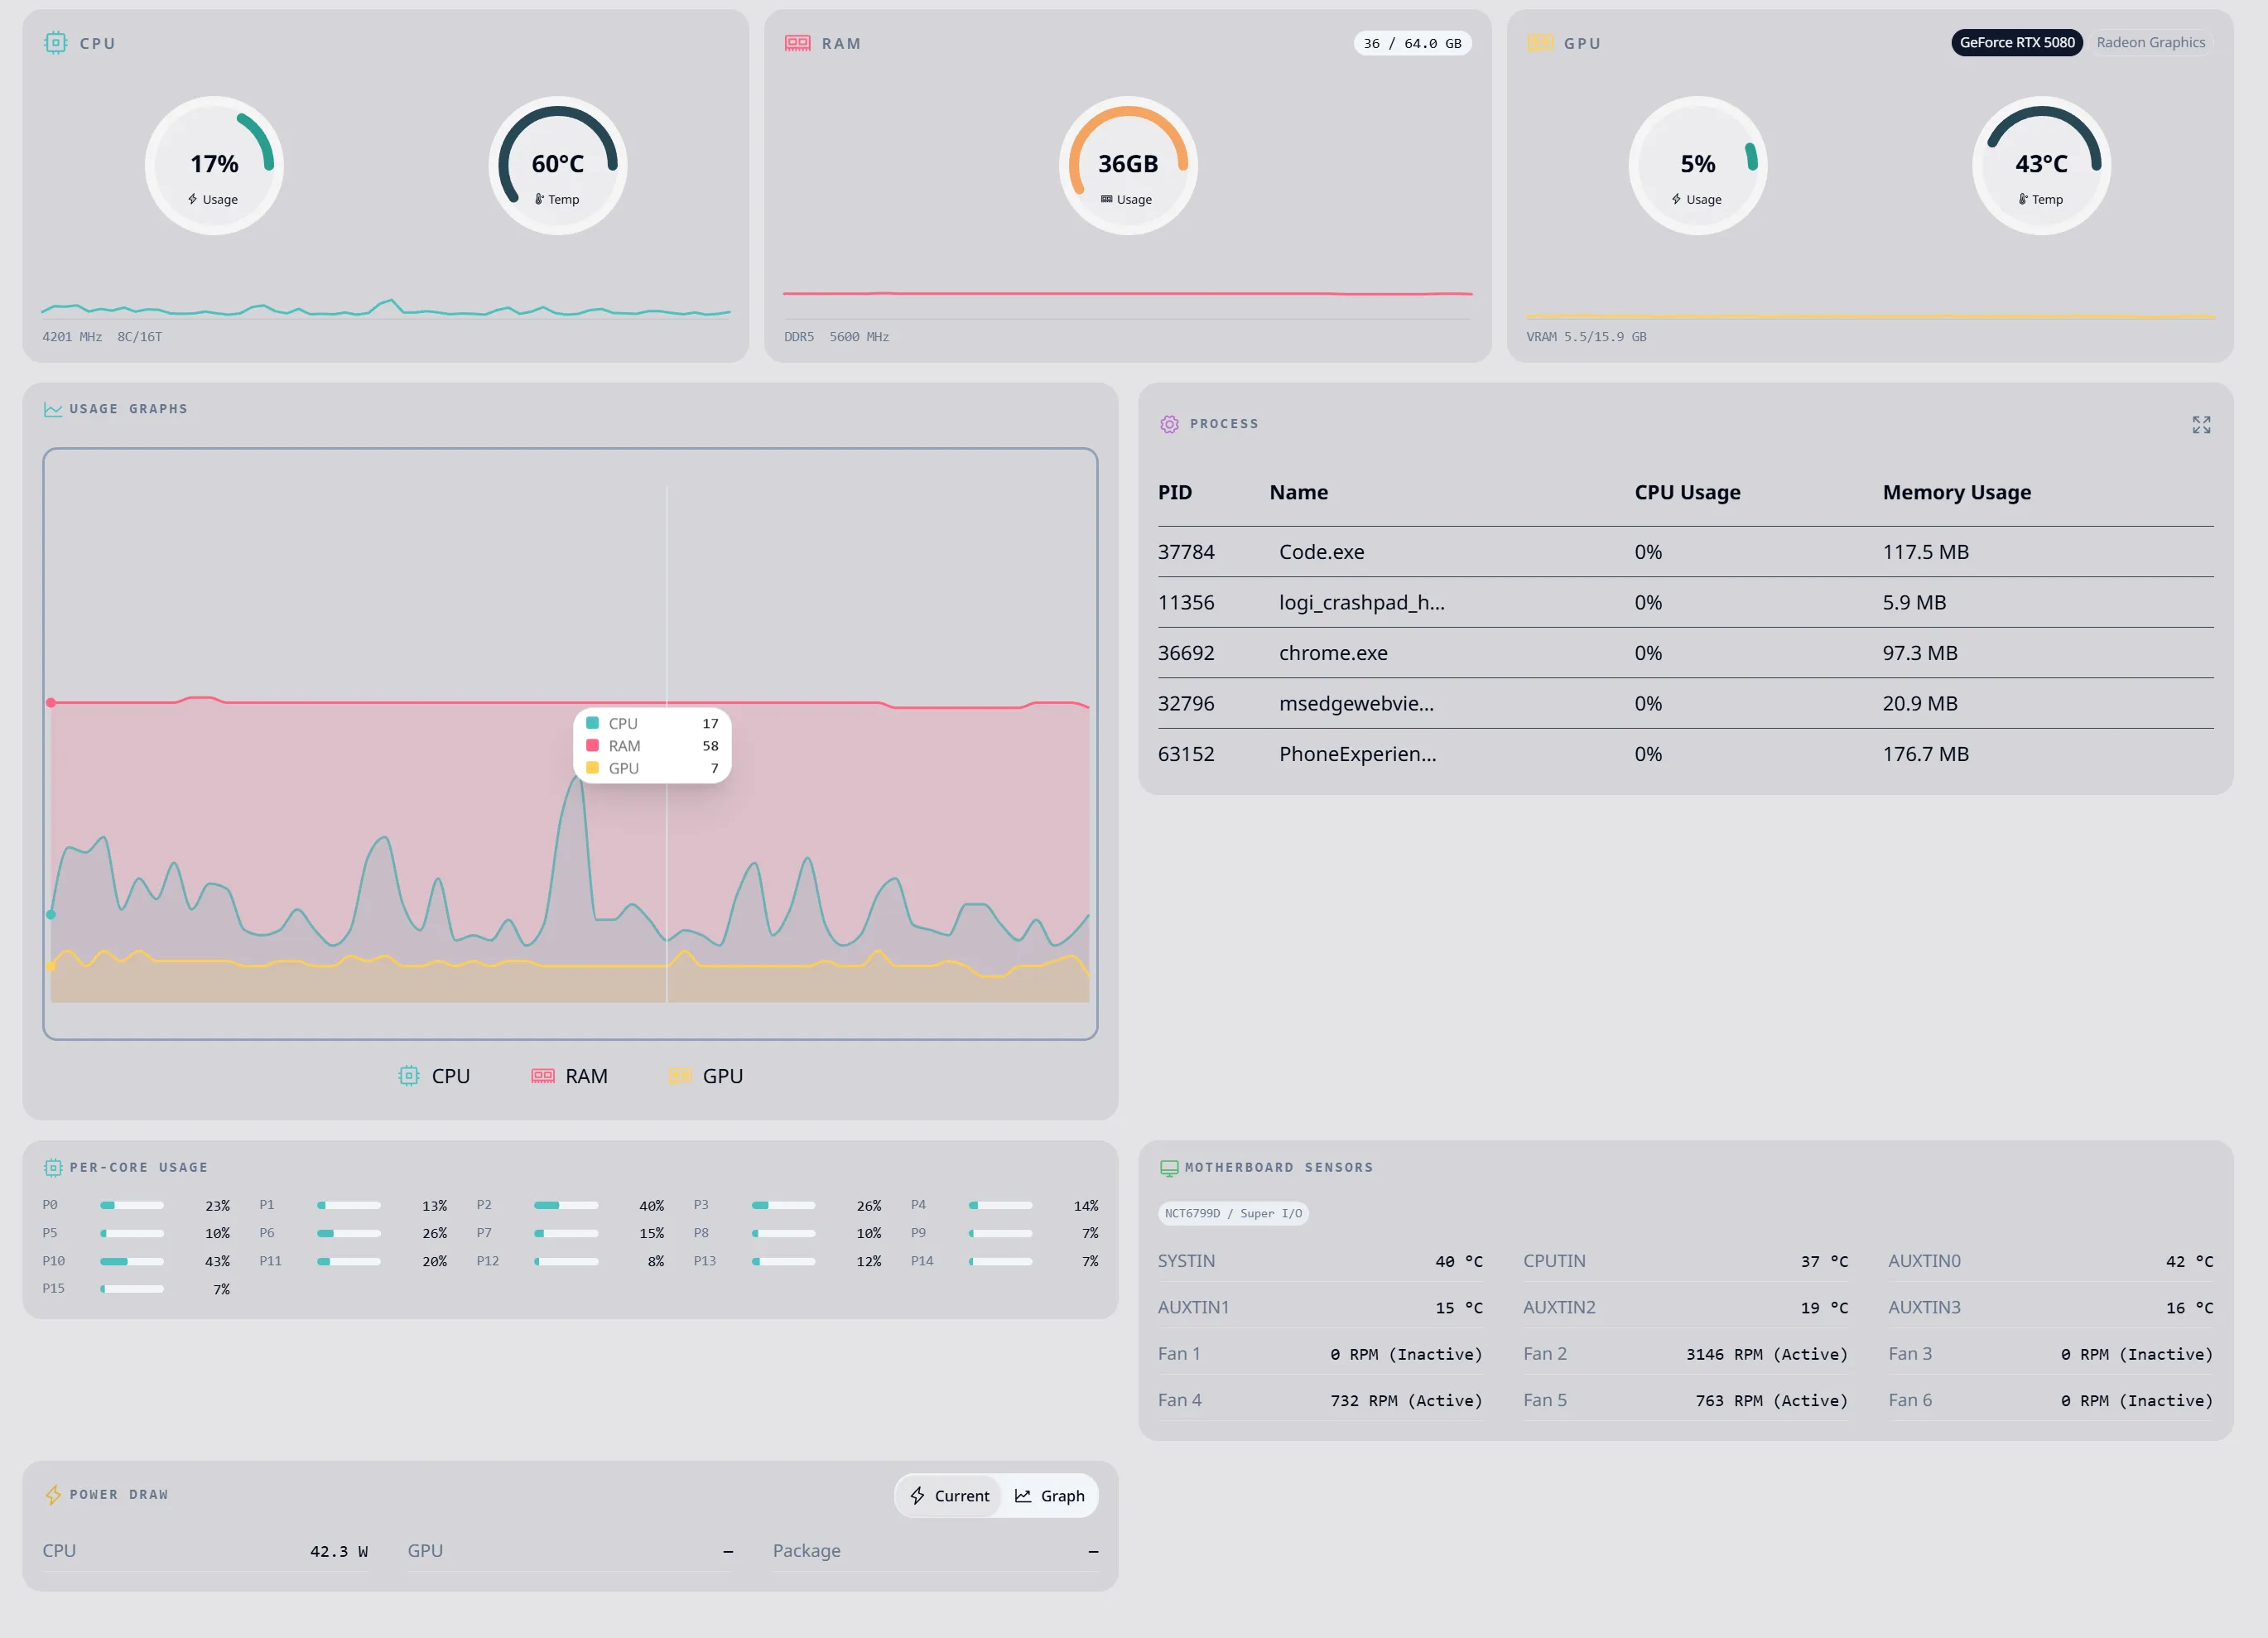
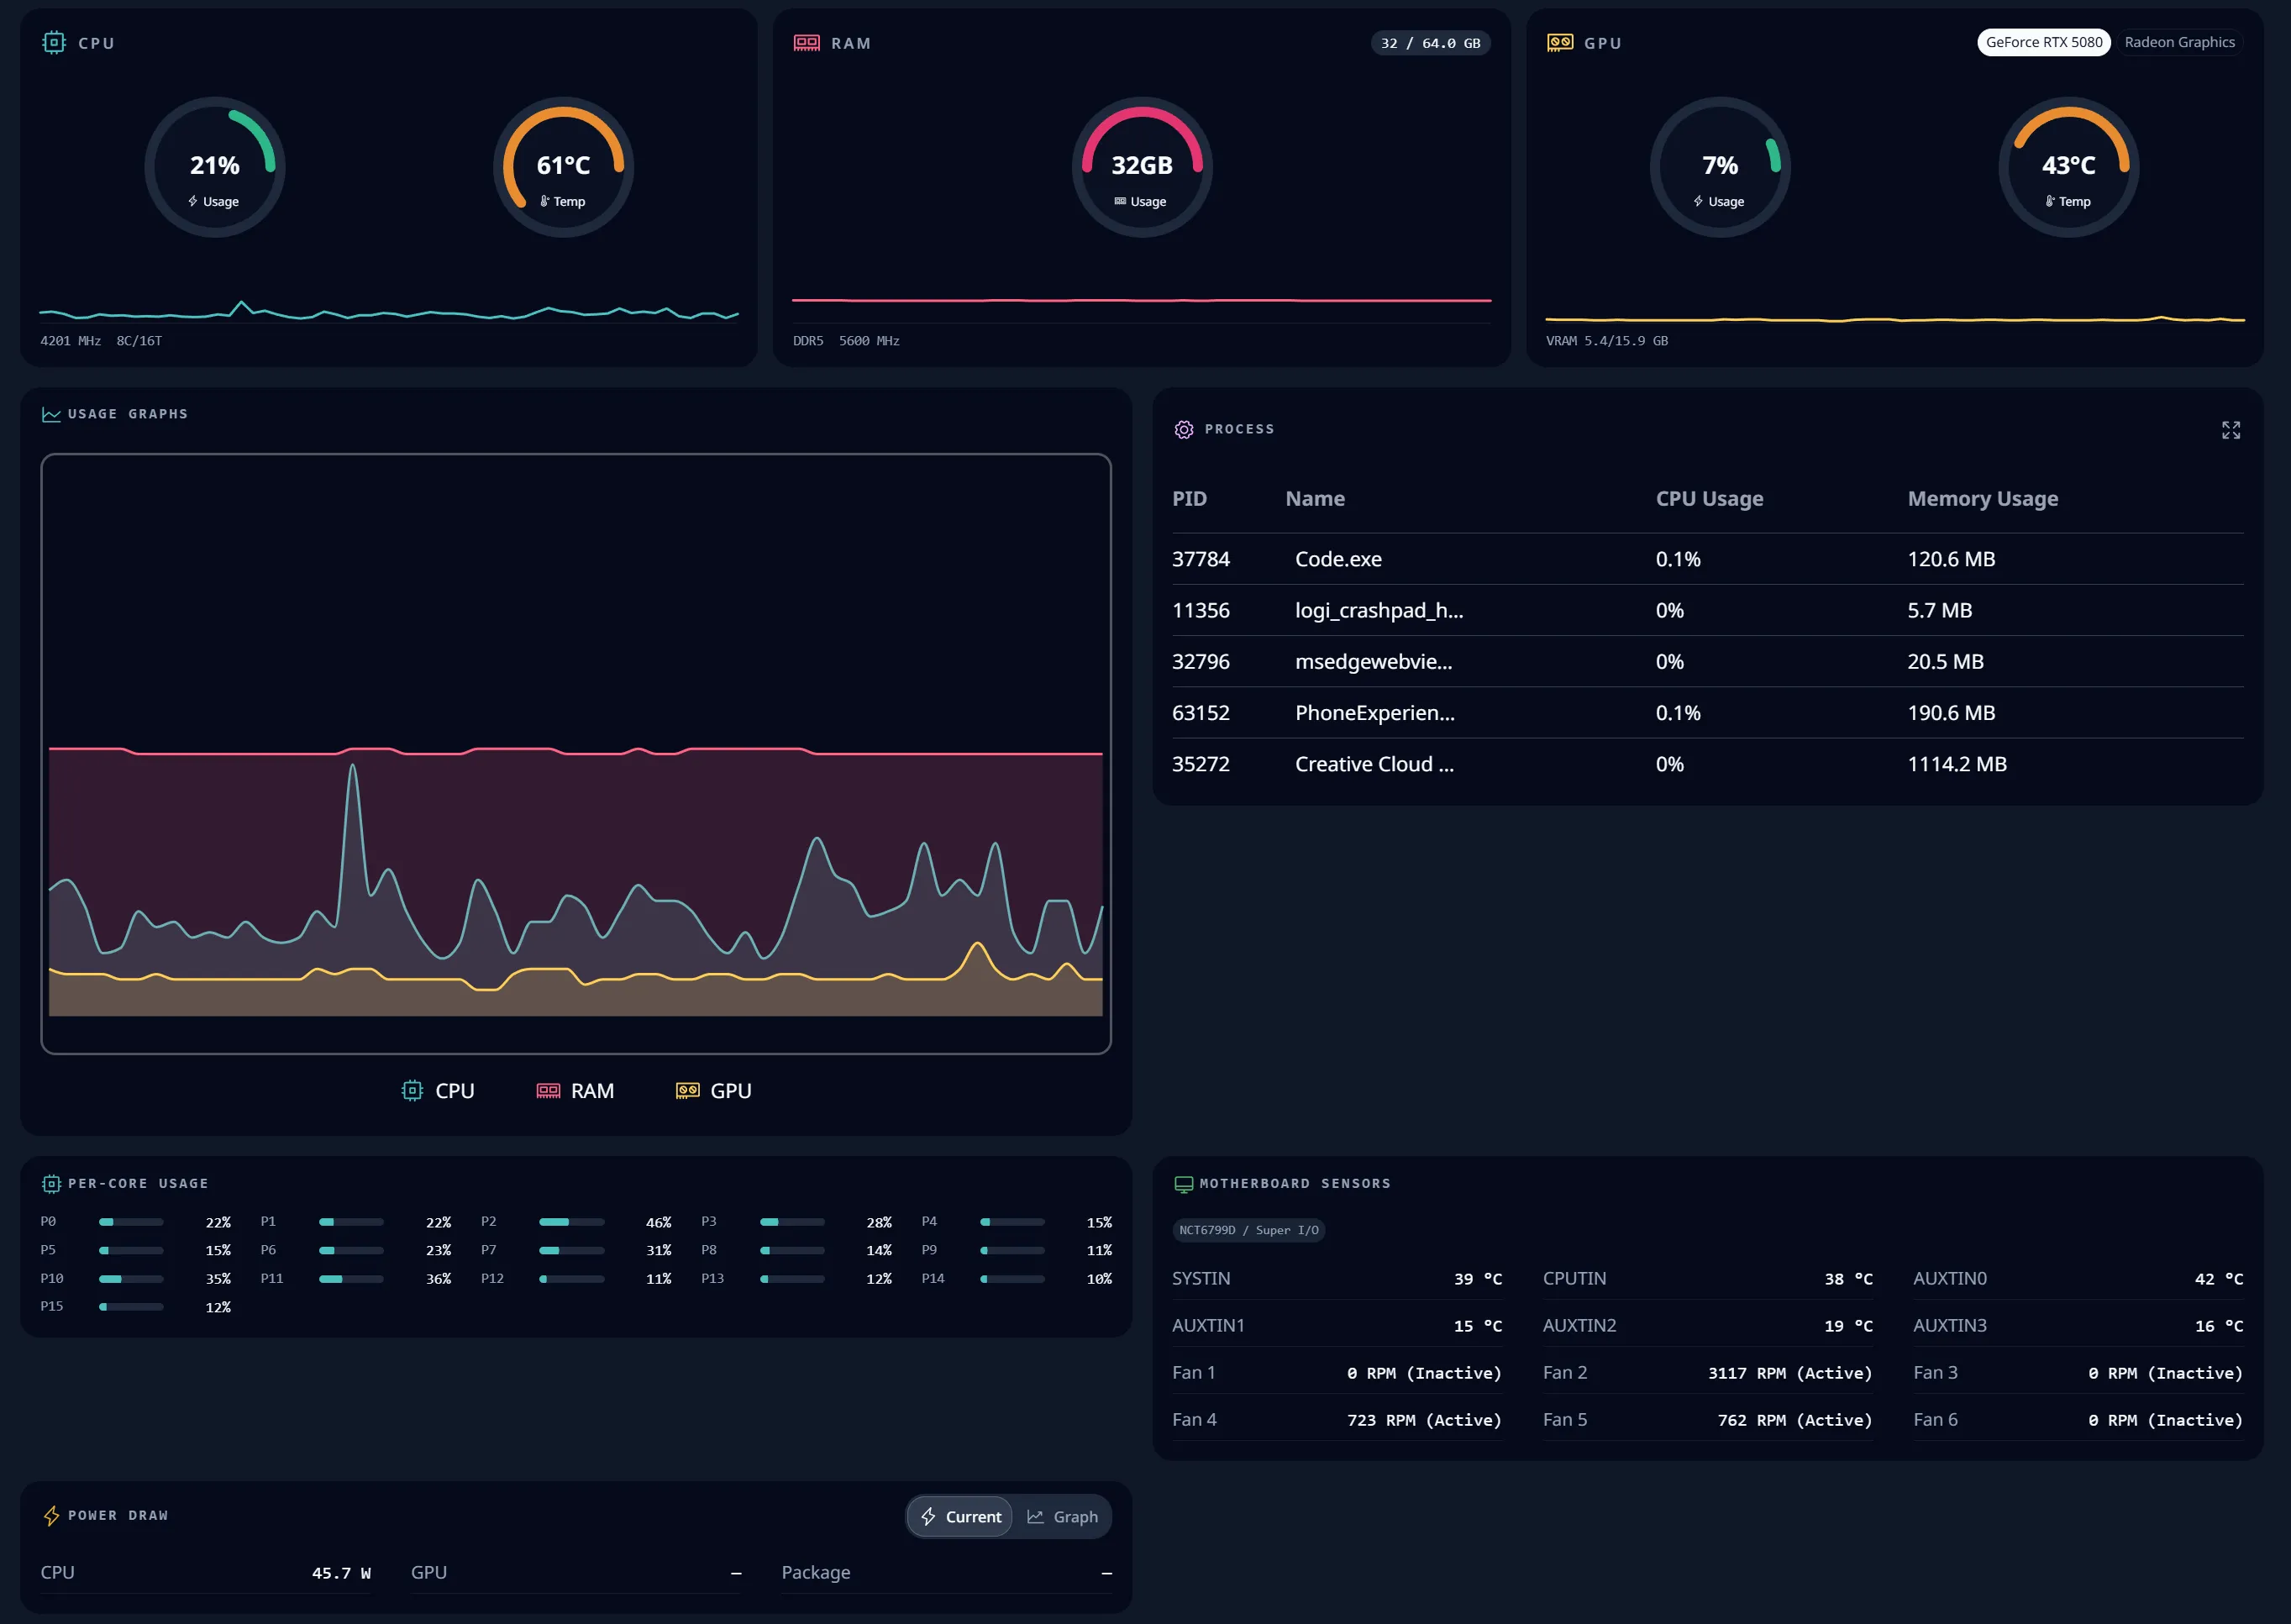
Use real-time CPU, GPU, temperature, and memory details when you need to inspect what your PC is doing right now.

CPU Monitoring

Track CPU usage, temperature, and frequency in real-time with detailed per-core statistics.

GPU Metrics

View GPU utilization, temperature, memory usage, and clock speeds for supported graphics cards.

Memory Analysis

Monitor RAM usage, available memory, and memory allocation across applications.

System Specifications

Look up CPU, GPU, memory, storage, and operating system details in one place.

Lightweight

Built with Tauri for minimal resource usage, ensuring the monitor itself doesn't impact system performance.

Cross-Platform & Open Source

Built in the open for Windows, macOS, and Linux under the MIT license.

Customize the Live View

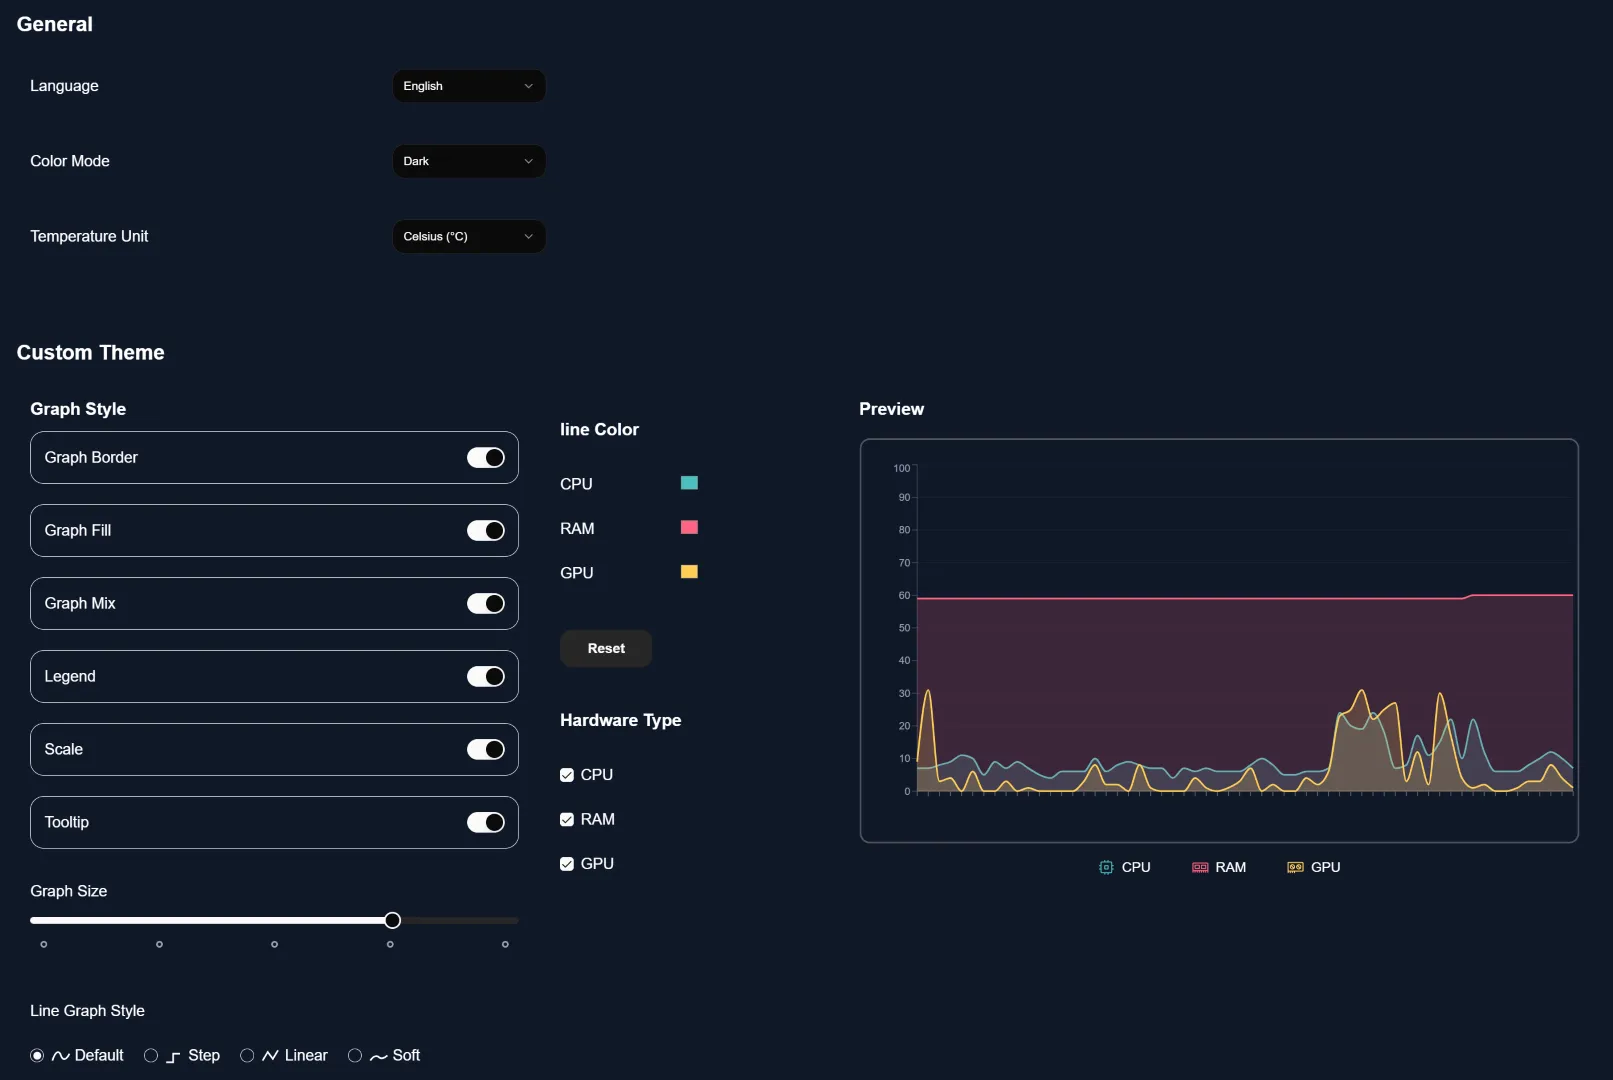
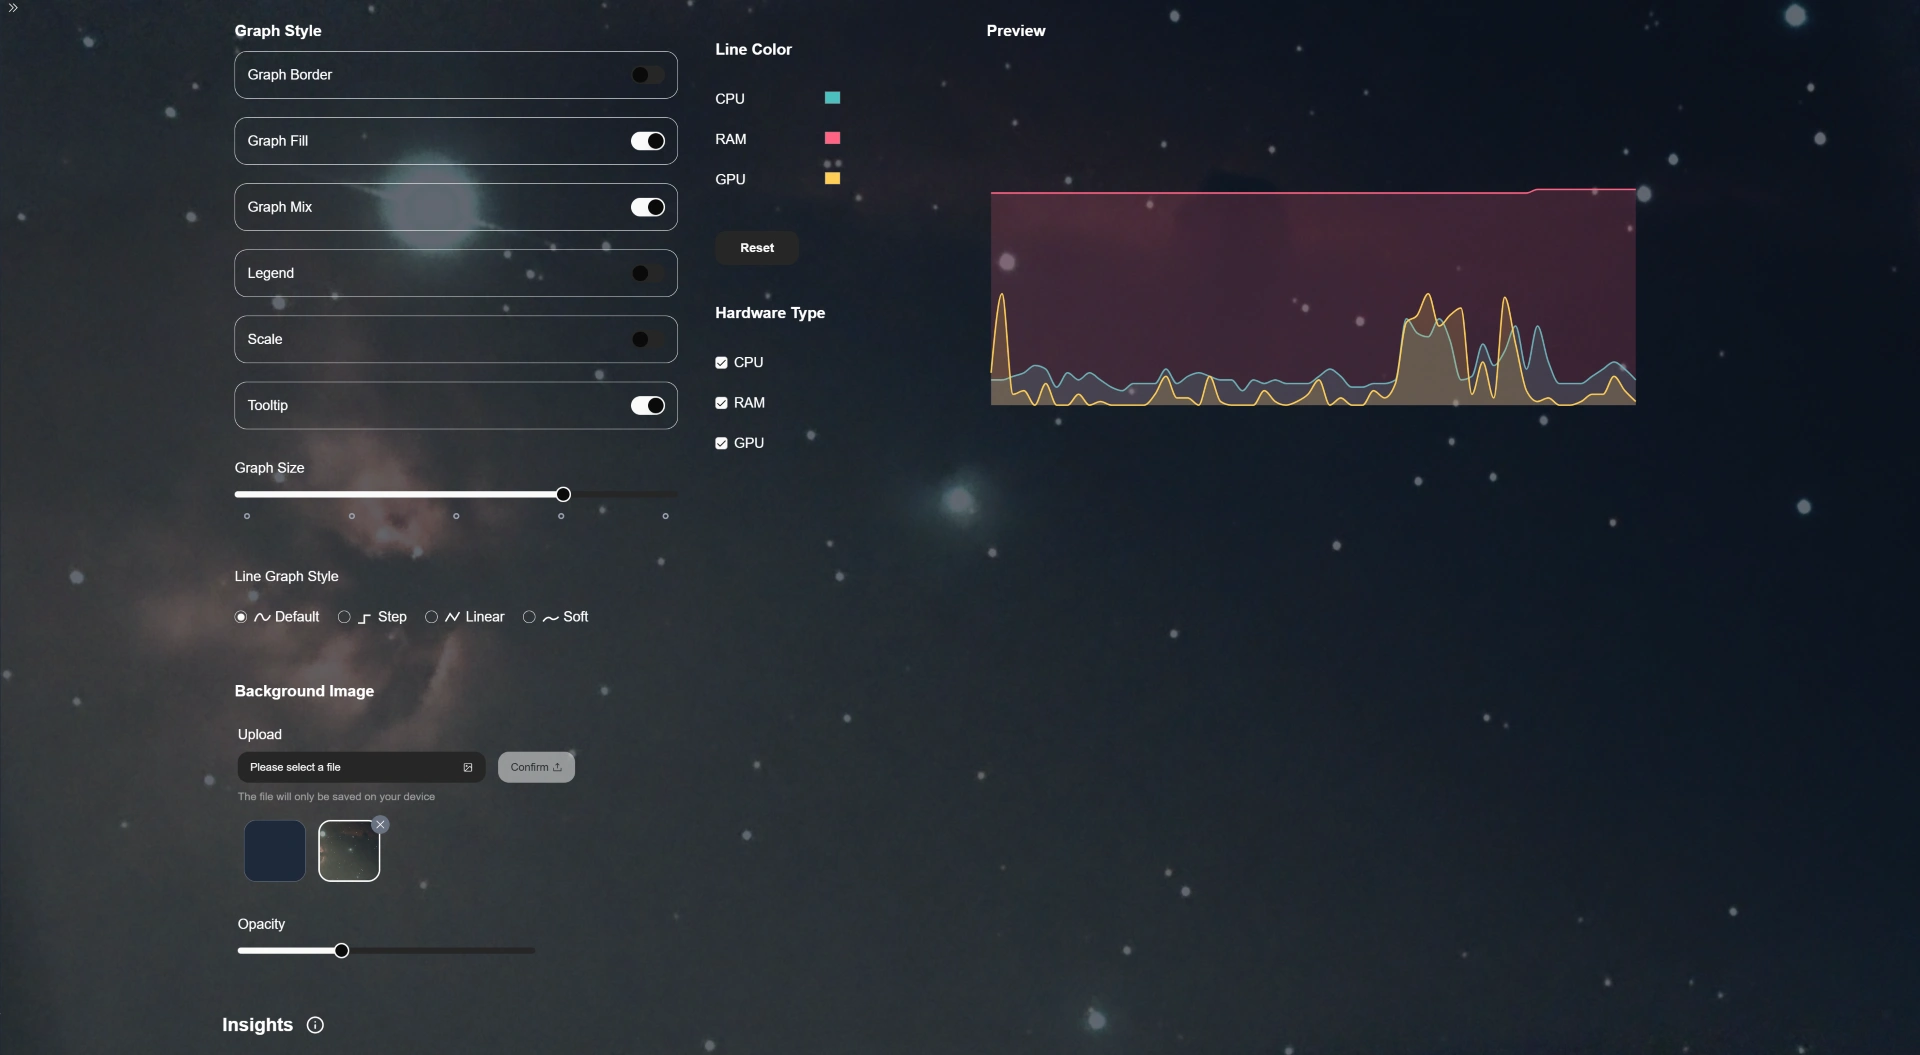
Keep the real-time dashboard readable your way with adjustable charts, colors, and a local background image.

Readable Live Charts

Line charts show current CPU, RAM, and GPU usage at a glance.

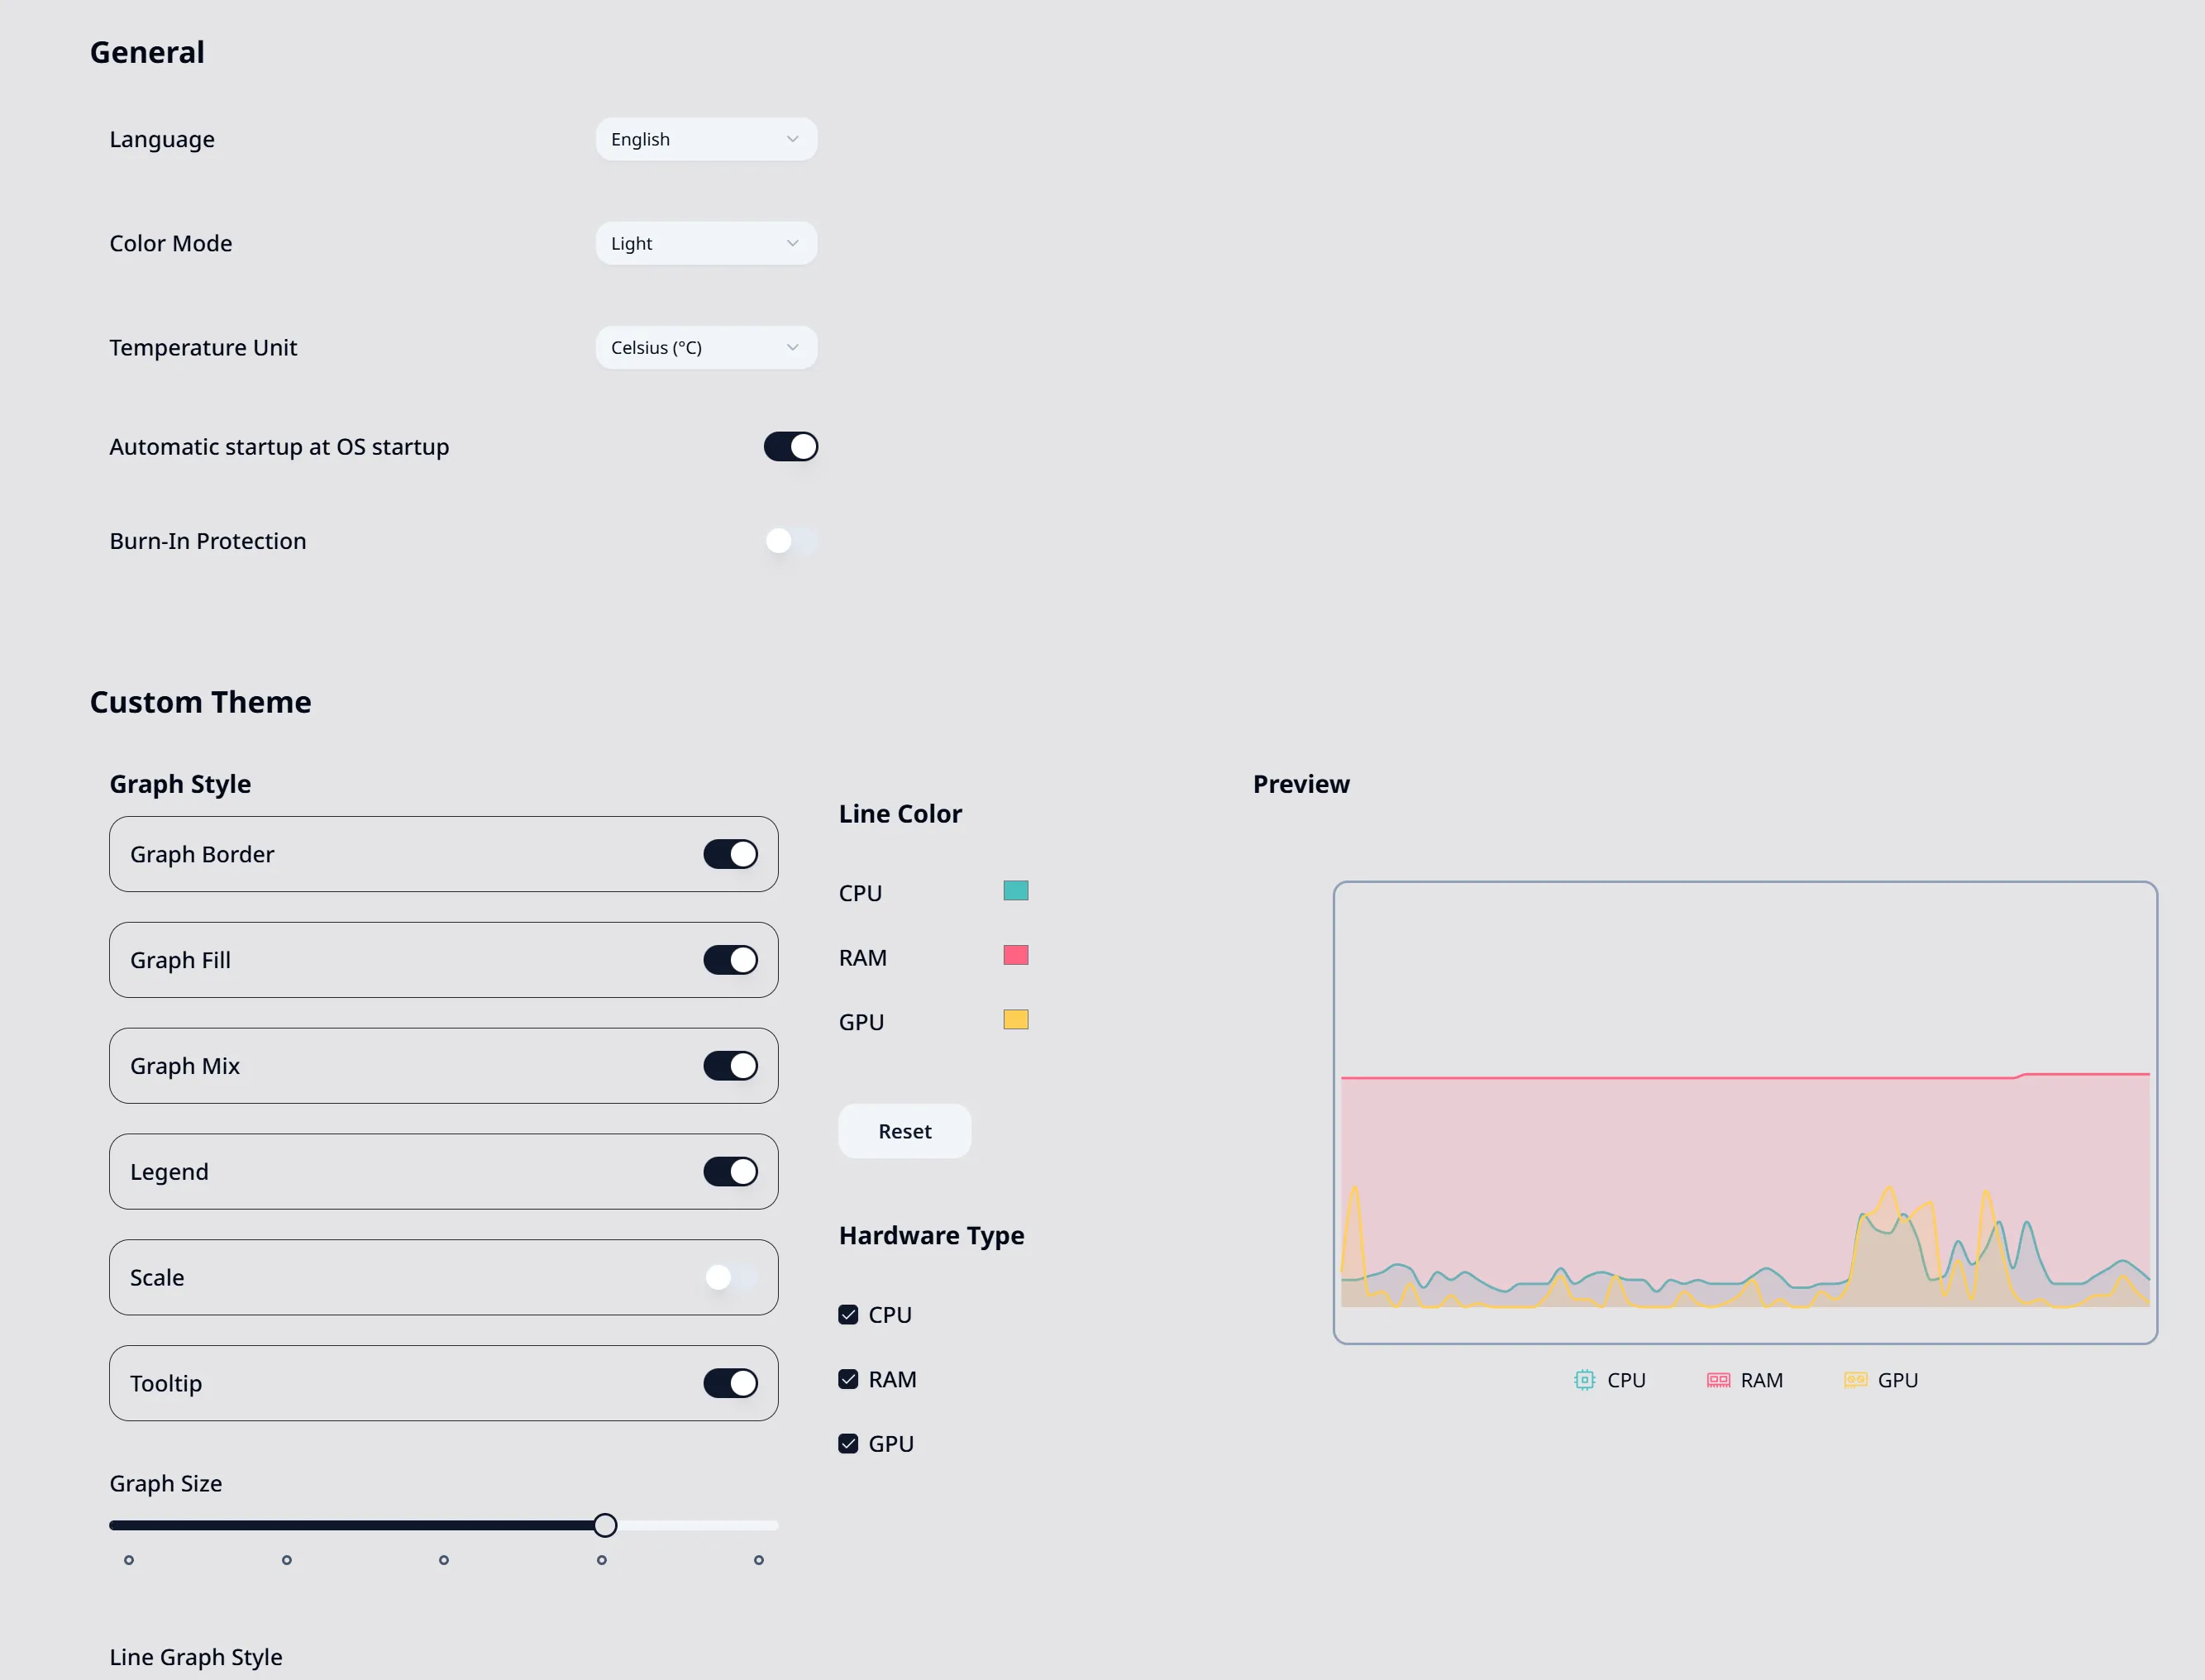
Custom Appearance

Tweak colors, borders, and legends with flexible visual settings.

Custom Wallpaper

Make your dashboard truly yours with a background image you love.

HardwareVisualizer dashboard using a custom local background image

Download HardwareVisualizer

Available for Windows, macOS, and Linux OS. Free and open source.

Current version: v1.10.1

Released: Aug 23, 2026, 04:45 AM UTC

Windows

Windows 10/11 (x64)

6.5 MBDownload

macOS

Apple Silicon (ARM64)

6.3 MBDownload

Intel (x64)

6.7 MBDownload

Linux

RPM-based Distros (.rpm)

6.4 MBDownload

AppImage (.AppImage)

80.3 MBDownload

Debian/Ubuntu (.deb)

6.4 MBDownload

Release highlights

  • Reorganized around Performance and System Specifications, with rearrangeable Panels, Compact, and Monitor views for live readings
  • CPU temperature history in Insights, with a new Cooling view for temperature analysis
  • GPU readings name their adapter, with adapter switching and multi-GPU fixes
  • Noticeably lighter while running — memory while hidden to the tray dropped from about 174 MB to about 32 MB
Read full changelog →
ReleaseNavigationPerformanceMotherboard SensorsCPU TemperatureGPUWindows

Looking for other versions or platforms?

View past versions →

Frequently Asked Questions

Common questions about HardwareVisualizer and hardware monitoring.

Q What is HardwareVisualizer?
A

HardwareVisualizer is a free, open-source, cross-platform hardware monitoring tool. It lets you track CPU temperature, GPU usage, memory allocation, and system performance in real-time with beautiful graphs and minimal system impact.

Q How is it different from Task Manager or HWiNFO?
A

HardwareVisualizer is designed to be lightweight with a modern UI. Unlike Task Manager, it provides detailed graphs and configurable long-term history, kept for 30 days by default and extendable in settings. Its always-on monitoring is optimized to minimize background CPU and memory use — when minimized to the system tray it uses only around 32 MB of memory — and the interface stays fully customizable.

Q Can I monitor hardware while gaming?
A

Yes! HardwareVisualizer runs in the background with minimal resource usage, making it perfect for monitoring CPU usage and memory during gaming sessions. GPU temperature monitoring is fully supported on NVIDIA GPUs, with partial support for AMD and Intel GPUs. You can also check historical data to see how your system performed.